Binary Patching & Anti-analysis
Bypassing Conditional Execution in an x86 Malware Sample
Objective
During malware analysis, analysts often encounter binaries that intentionally prevent malicious functionality from executing unless very specific conditions are met. These checks may rely on environment validation, internet connectivity, registry values, mutexes, or cryptographic verification.
Instead of recreating the expected environment, an analyst can patch the binary to force execution down the desired code path.
Understanding the Original Program
The original Nim source code performs the following operations:
- Download a file (
key.crt) from a remote server. - Compute the SHA-256 hash of the downloaded data.
- Compare the hash against a hardcoded value.
- Execute the payload only if the hashes match.
Conceptually the program behaves like this:
1
2
3
4
5
6
7
8
9
10
11
12
13
14
Download key.crt
        │
        ▼
Calculate SHA256
        │
        ▼
Compare with hardcoded hash
        │
   ┌────┴─────┐
   │          │
 Match     No Match
   │          │
   ▼          ▼
Payload    Print Error
Since the original server is unavailable, the comparison always fails, preventing the payload from executing.
Entering the Program
Opening the executable inside Cutter initially shows the standard main() entry point.
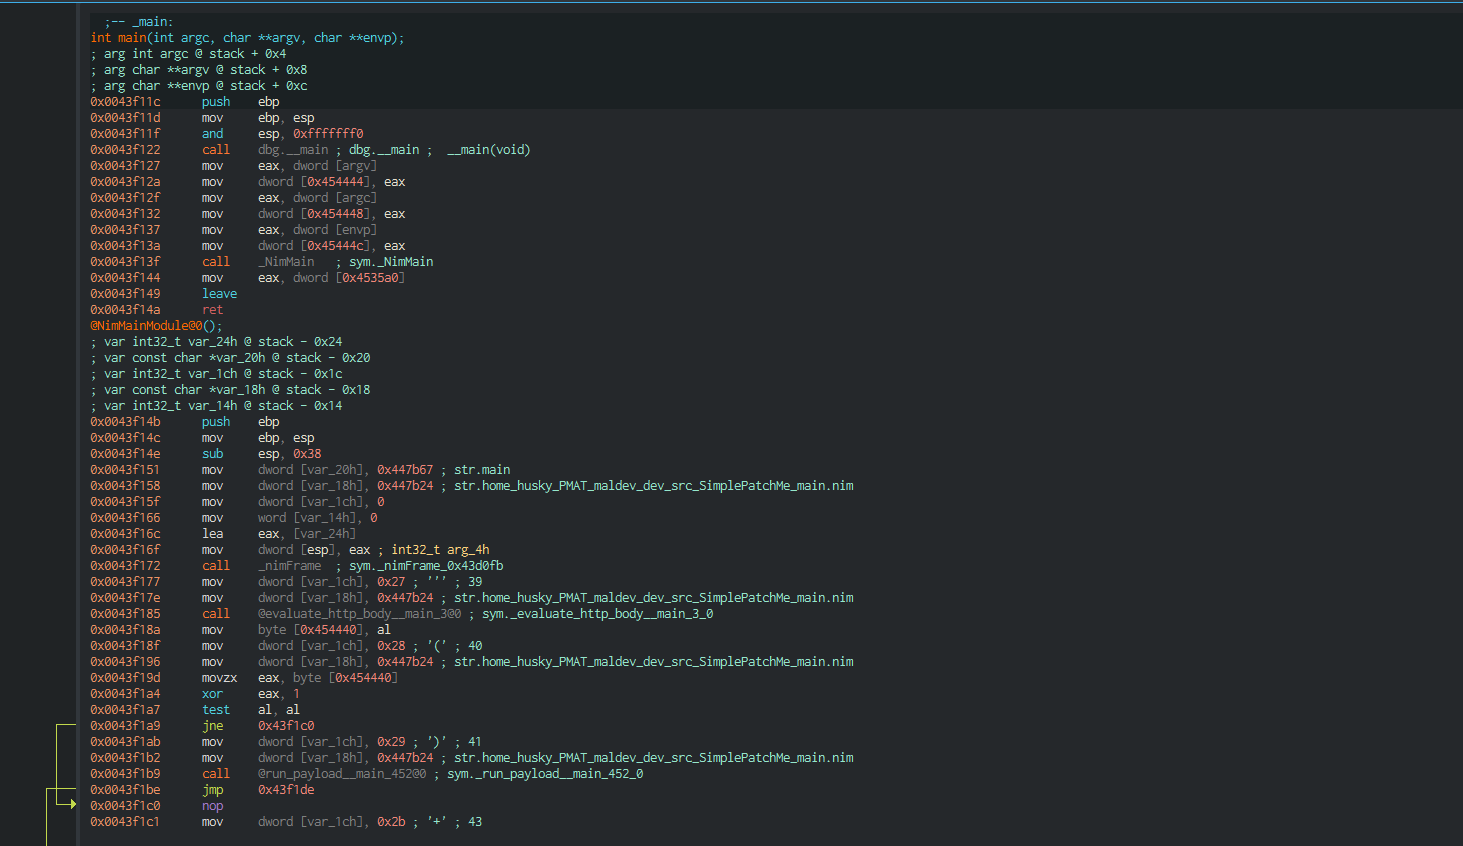
The first function is mostly initialization code generated by the Nim compiler. It prepares the runtime before transferring execution into the actual program logic.
Following the execution flow leads into NimMainInner().
NimMainInner()
The decompiler reveals that NimMainInner() performs almost no work itself.
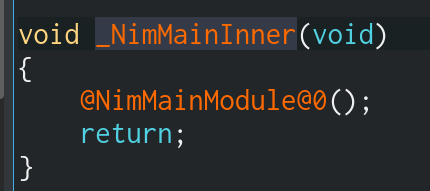
It simply calls:
1
@NimMainModule@0();
This function contains the real application logic generated from the original source code.
The Real Main Function
Inside NimMainModule() we finally reach the code we care about.
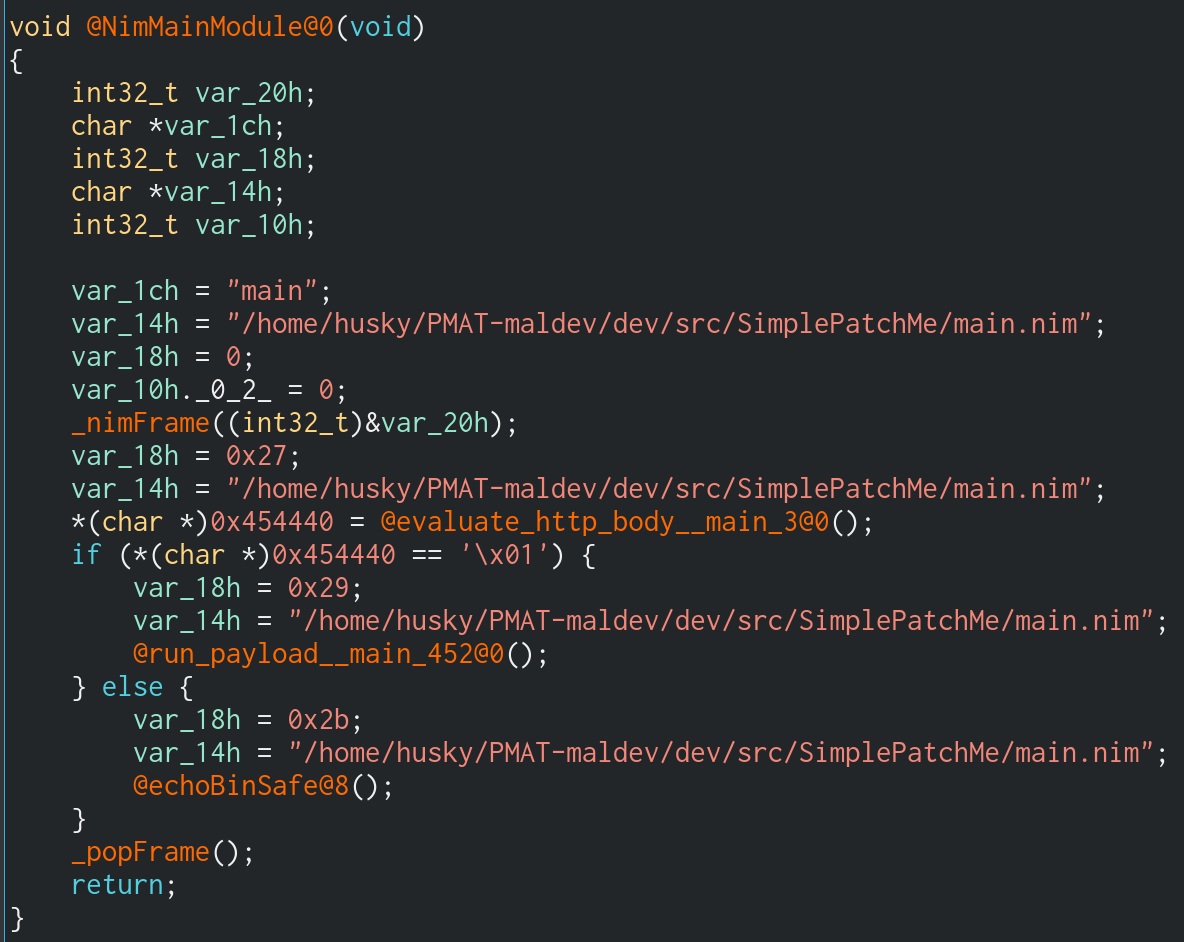
Even without reading assembly, several important function names immediately stand out because symbols have not been stripped:
evaluate_http_body()run_payload()echoBinSafe()
From the decompiled code we can see the following logic:
1
2
3
4
5
6
7
8
9
10
result = evaluate_http_body();

if(result)
{
    run_payload();
}
else
{
    echoBinSafe();
}
This perfectly matches the original source code.
Control Flow Graph
Switching to Graph View makes the program significantly easier to understand.
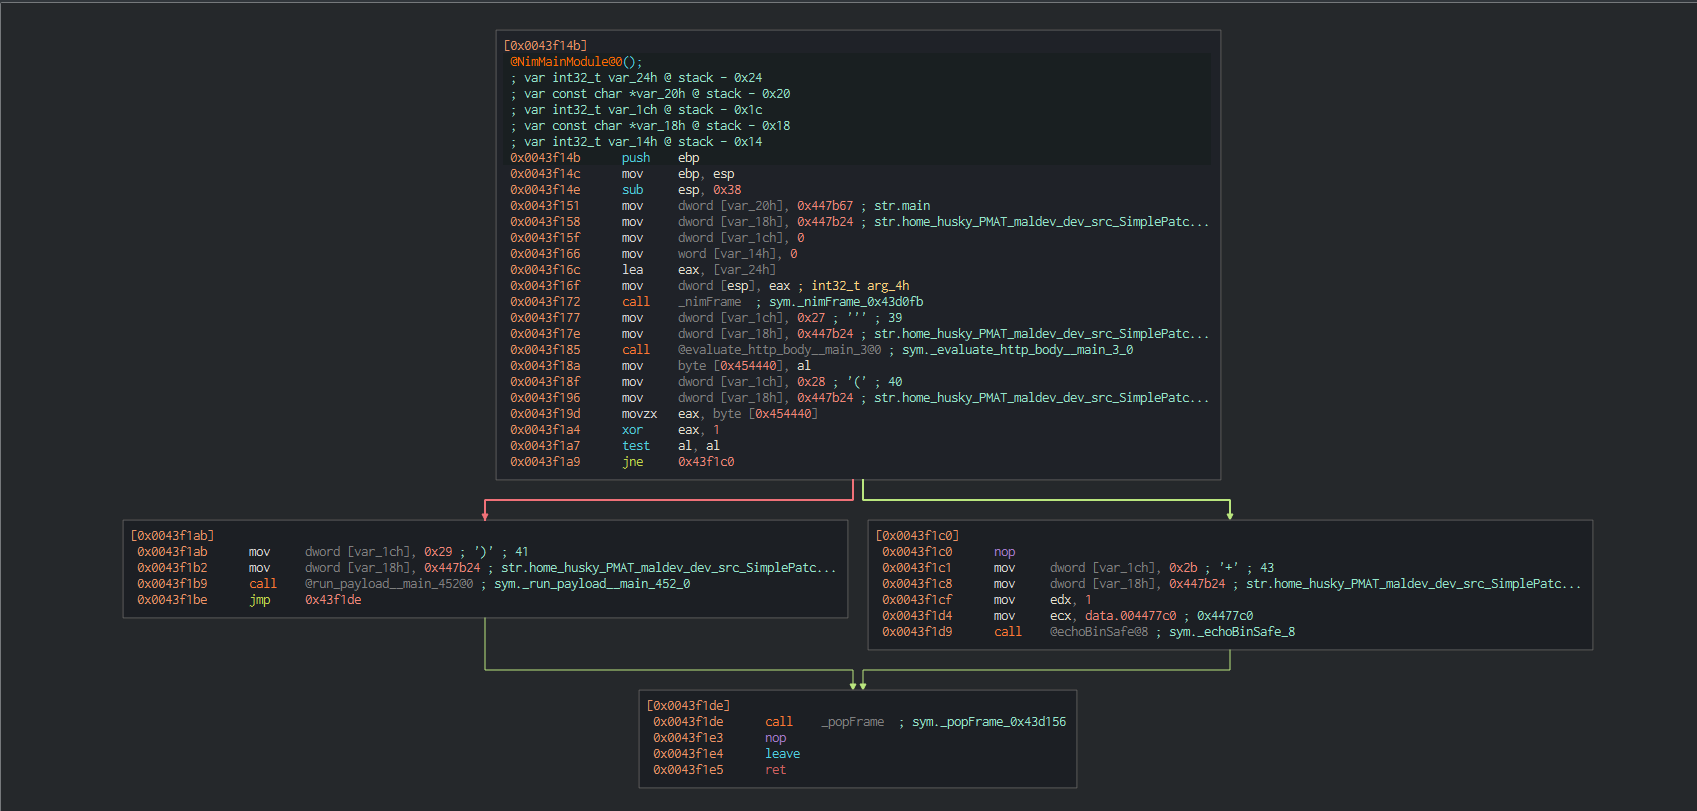
The graph clearly shows two execution paths.
Path 1
If the verification succeeds:
1
2
3
4
evaluate_http_body()
        │
        ▼
run_payload()
Path 2
If verification fails:
1
2
3
4
evaluate_http_body()
        │
        ▼
echoBinSafe()
The decision between these two paths is controlled by a single conditional jump instruction.
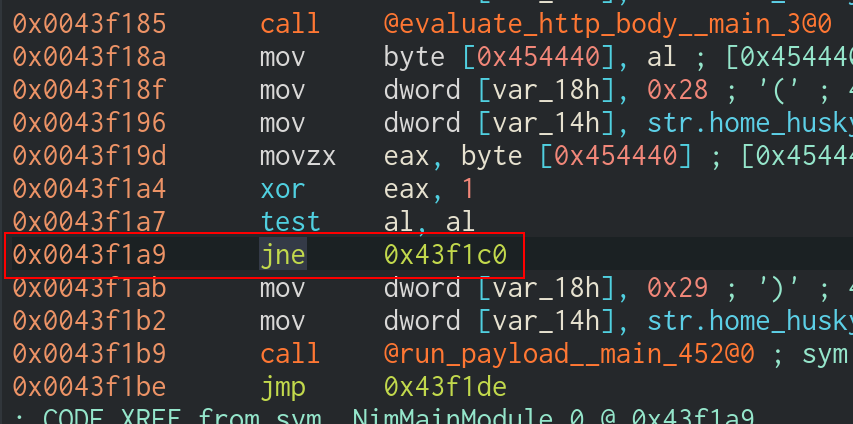
Following the Assembly
The important instructions are shown below:
call    evaluate_http_body
mov     byte [0x454440], al
movzx   eax, byte [0x454440]
xor     eax, 1
test    al, al
jne     0x43f1c0
Although this looks complicated, each instruction performs one small task.
Step 1 – Execute the Verification Function
The first instruction calls the verification routine.
call evaluate_http_body
The function returns either:
- TRUE (1)
- FALSE (0)
Like most x86 functions, the return value is placed into the EAX register.
Since this value is only one byte, the lower portion of EAX (AL) is used.
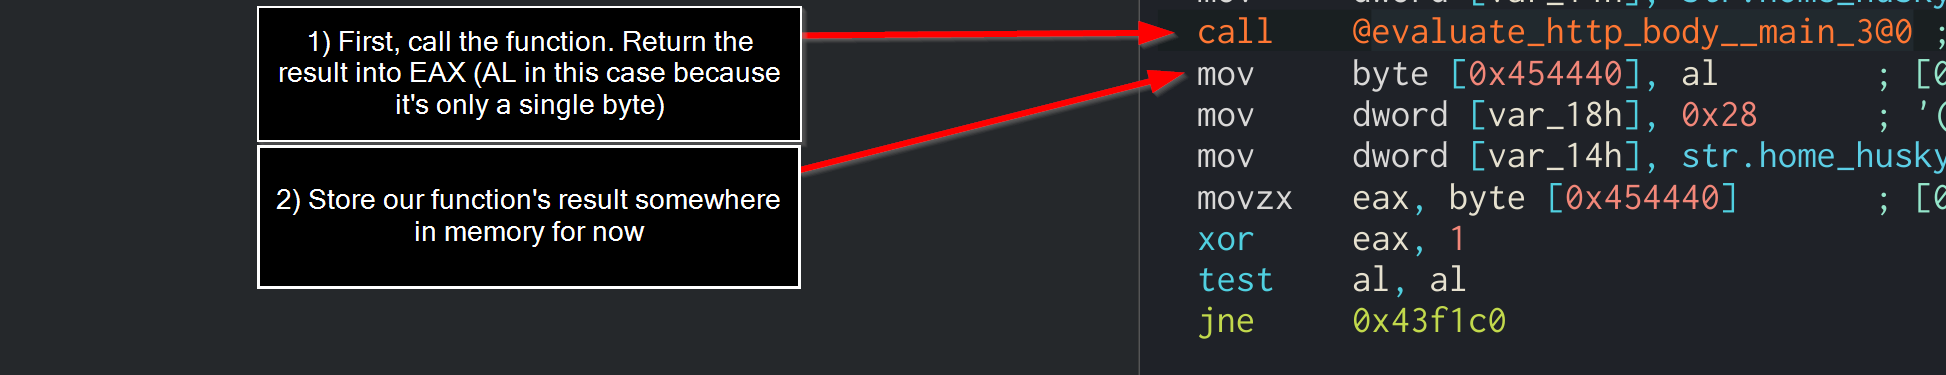
Step 2 – Store the Result
Immediately after the function returns, the value inside AL is copied into memory.
mov byte [0x454440], al
This simply preserves the result temporarily.
Nothing has been modified yet.
Step 3 – Restore the Value
Next, the stored byte is copied back into EAX.
movzx eax, byte [0x454440]
The MOVZX instruction means:
Move with Zero Extension
Because only one byte is being loaded, the processor clears the remaining bits of EAX.
Example:
1
2
3
4
5
AL = 01

↓

EAX = 00000001
This produces a clean 32-bit value for later operations.
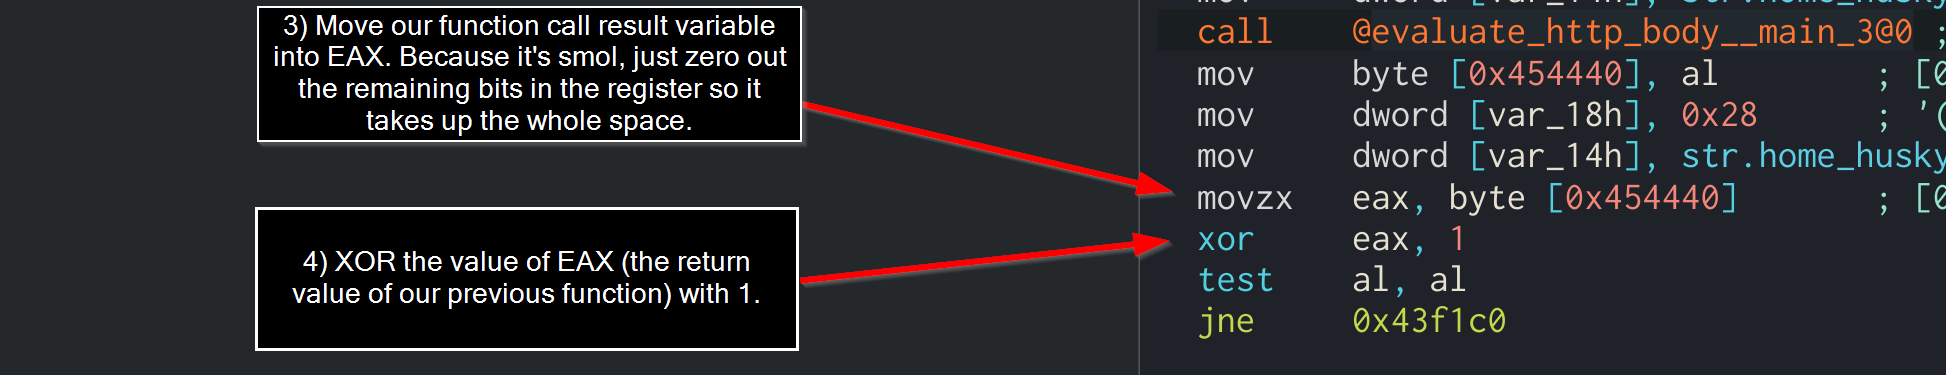
Step 4 – XOR with 1
Now comes the instruction that changes everything.
xor eax,1
XOR behaves as follows:
| Input | XOR 1 | Result |
|---|---|---|
| 0 | 1 | 1 |
| 1 | 1 | 0 |
Therefore:
If evaluate_http_body() returns:
1
2
3
4
5
6
7
8
9
TRUE (1)

↓

1 XOR 1

↓

0
If it returns:
1
2
3
4
5
6
7
8
9
FALSE (0)

↓

0 XOR 1

↓

1
The result has now been inverted.
Step 5 – TEST Instruction
Next comes:
test al, al
Unlike CMP, the TEST instruction performs a bitwise AND without modifying the register.
1
AL AND AL
Its only purpose here is to update the processor flags.
Most importantly:
- Zero Flag (ZF)
If AL equals zero:
1
ZF = 1
Otherwise:
1
ZF = 0
Step 6 – The Conditional Jump
Finally:
jne 0x43f1c0
JNE means:
Jump if Not Equal
More accurately:
Jump when the Zero Flag is 0.
Therefore:
If ZF = 0
Execution jumps into the failure branch.
1
2
3
4
5
6
7
8
9
10
11
12
13
14
15
16
17
18
19
20
21
evaluate_http_body()

↓

FALSE

↓

xor

↓

ZF = 0

↓

JNE Taken

↓

echoBinSafe()
If ZF = 1
The jump is not taken.
Execution simply continues downward.
1
2
3
4
5
6
7
8
9
10
11
12
13
14
15
16
17
18
19
20
21
evaluate_http_body()

↓

TRUE

↓

xor

↓

ZF = 1

↓

JNE NOT Taken

↓

run_payload()
This single instruction determines which branch executes.
The Problem
Running the executable normally produces:
1
2
3
[-] Error: No such host is known.

[-] No dice, sorry :(
The remote server no longer exists, meaning:
- HTTP request fails
- SHA-256 comparison fails
- Payload never executes
Without modifying the binary, there is no practical way to satisfy the original condition.
Binary Patching
Since we control the executable, we can modify its instructions.
Instead of trying to recreate the missing server, we simply alter the program’s logic.
The easiest modification is to reverse the conditional jump.
Original instruction:
jne
Patched instruction:
je
This changes the branch logic completely.
Applying the Patch in Cutter
Navigate to the conditional jump instruction.
Right-click the instruction and select:
1
2
3
Edit
    ↓
Reverse Jump
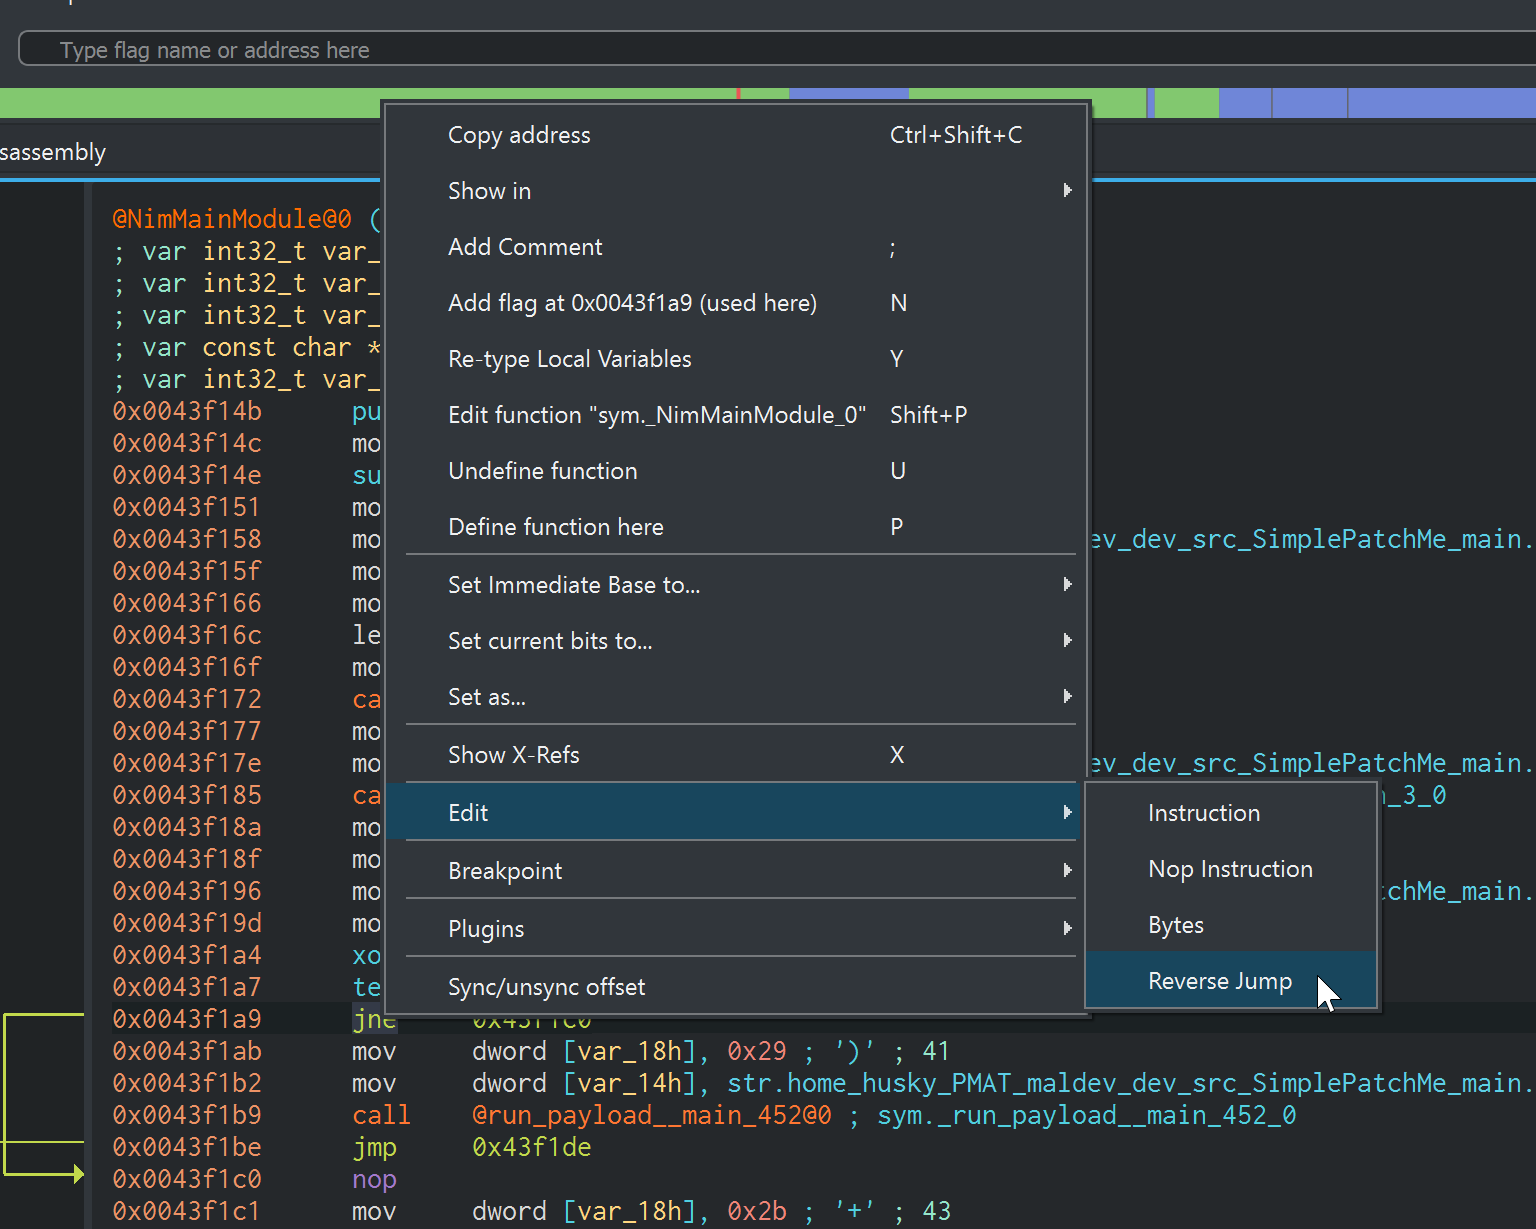
Cutter automatically replaces:
jne
with
je
without changing instruction size or affecting surrounding code.
Result
Running the original executable:
1
2
3
[-] Error: No such host is known.

[-] No dice, sorry :(
Running the patched executable:
1
2
3
[-] Error: No such host is known.

[!] Boom!
Even though the HTTP request still fails, the payload executes because we modified the program’s decision-making process.
Key Takeaways
- Malware frequently protects its payload behind conditional checks.
- Reverse engineering allows analysts to identify the exact instruction controlling execution flow.
- Conditional jumps such as JNE, JE, JG, and JL often determine whether malicious functionality is executed.
- Small binary patches can completely alter program behavior without modifying large portions of code.
- Cutter provides an easy way to patch instructions using Edit → Reverse Jump, making it an effective tool for malware analysis and reverse engineering.
Part 2 – Defeating the IsDebuggerPresent() Anti-Debugging Technique
Introduction
One of the oldest and most common anti-analysis techniques used by malware is detecting whether it is being executed under a debugger.
Windows provides an API named IsDebuggerPresent() that allows a program to determine if a user-mode debugger is attached to its process. Malware frequently uses this API to prevent analysts from observing its malicious behavior. If a debugger is detected, the malware may terminate, display a fake error, or avoid executing its payload entirely.
Although this technique is relatively simple, understanding how it works provides an excellent introduction to malware anti-analysis and demonstrates how reverse engineers can bypass runtime protections.
Locating the Anti-Debugging Logic
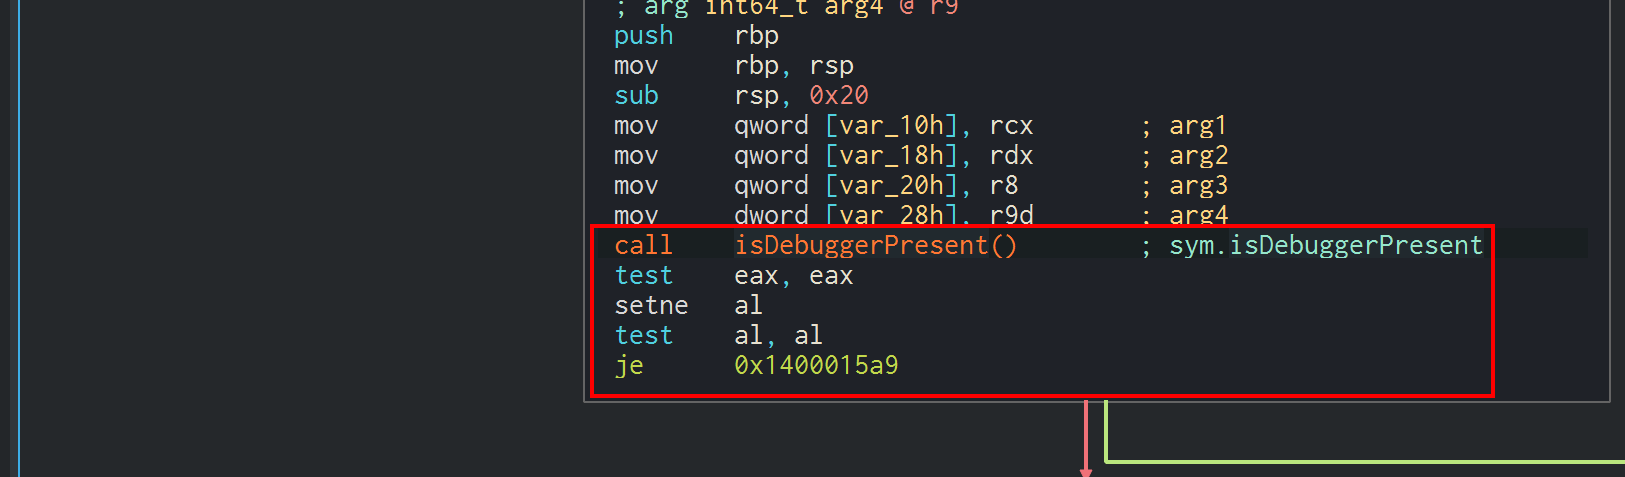
Open the executable in Cutter and navigate to the WinMain() function.
This function contains the primary execution logic of the program.
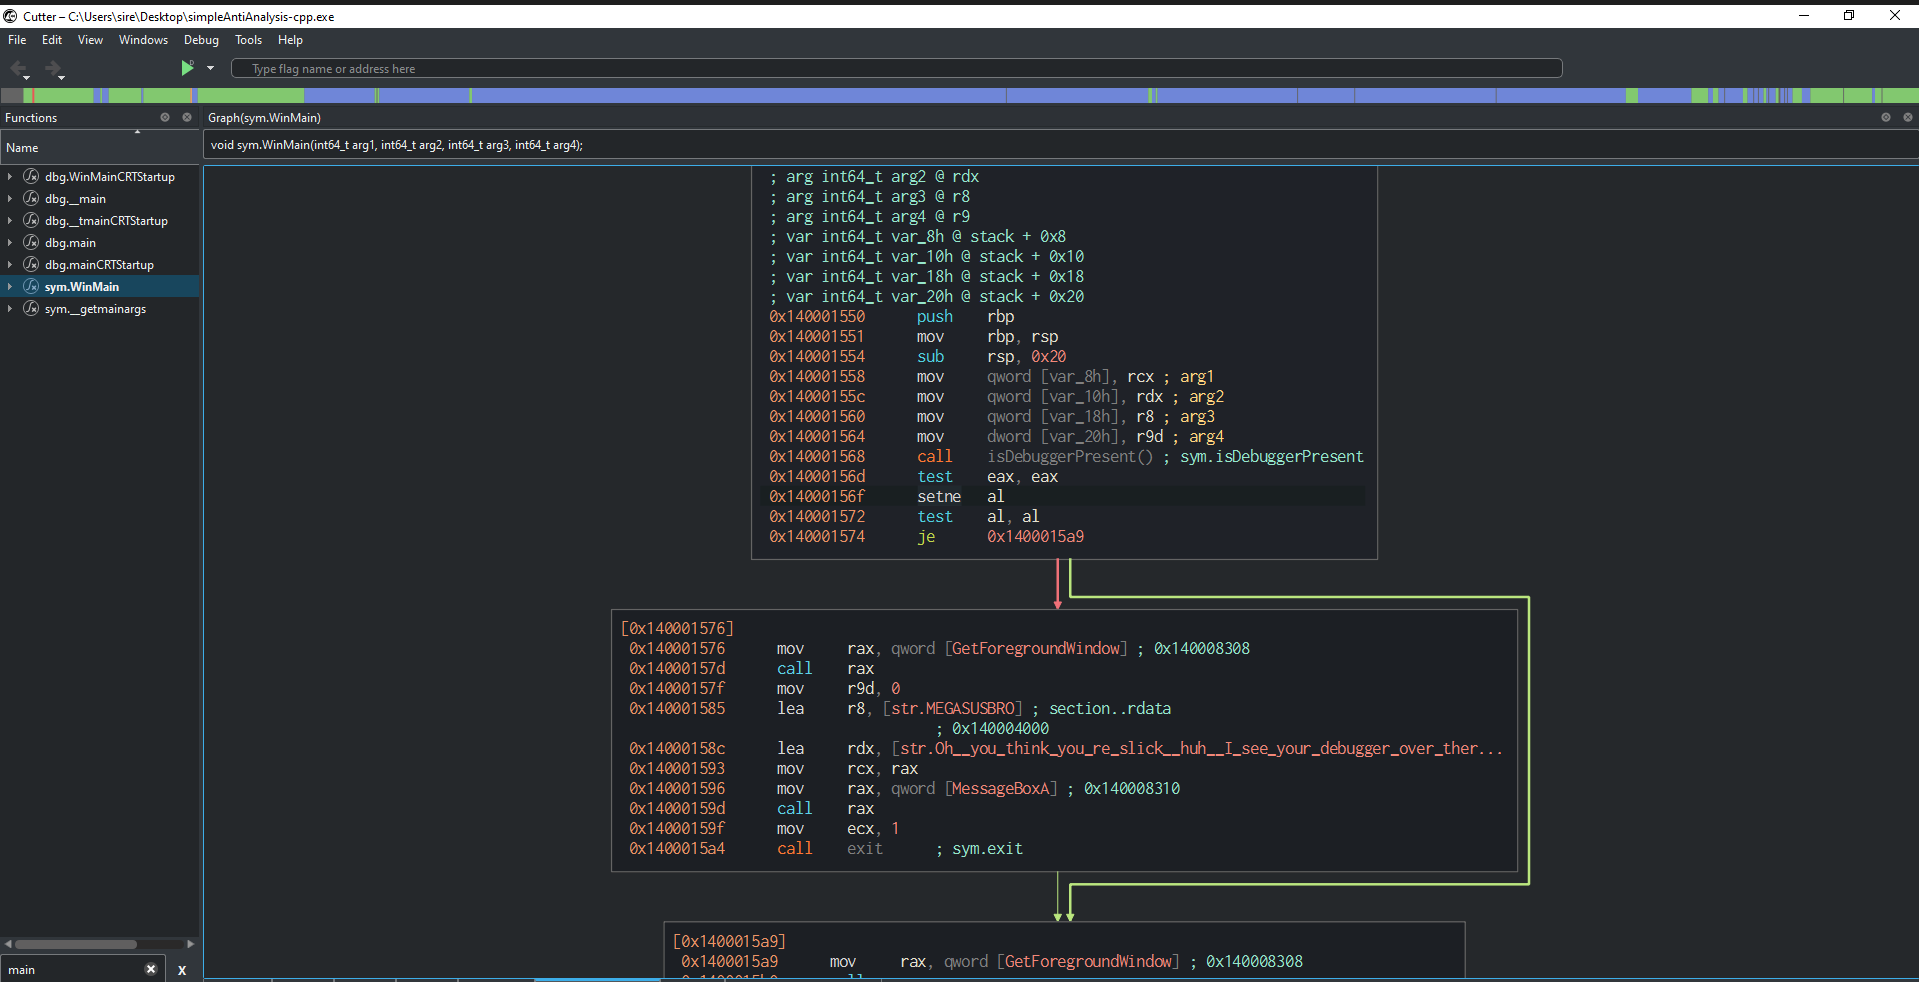
Immediately, one API call stands out:
call IsDebuggerPresent
Since the binary retains its symbols, identifying the anti-debugging routine is straightforward.
Understanding IsDebuggerPresent()
According to the Microsoft documentation:
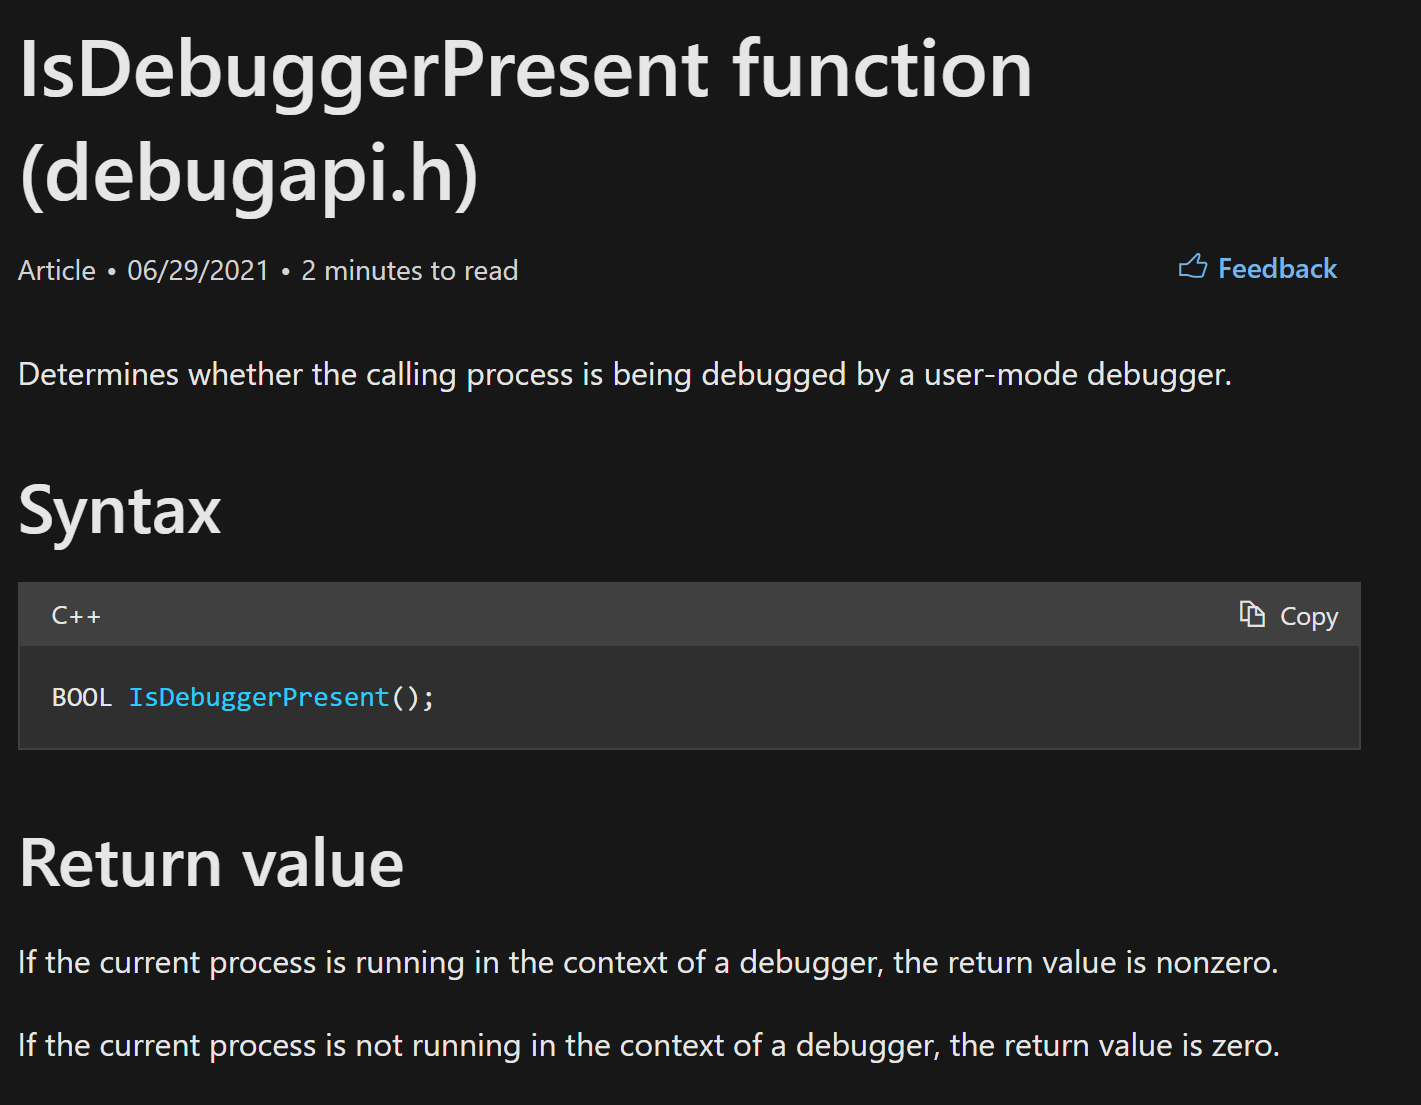
IsDebuggerPresent() determines whether the current process is running under a user-mode debugger.
It returns a Windows BOOL value.
| Return Value | Meaning |
|---|---|
| 0 | No debugger detected |
| Non-zero (typically 1) | Debugger detected |
This single return value determines which execution path the malware follows.
Examining the Assembly
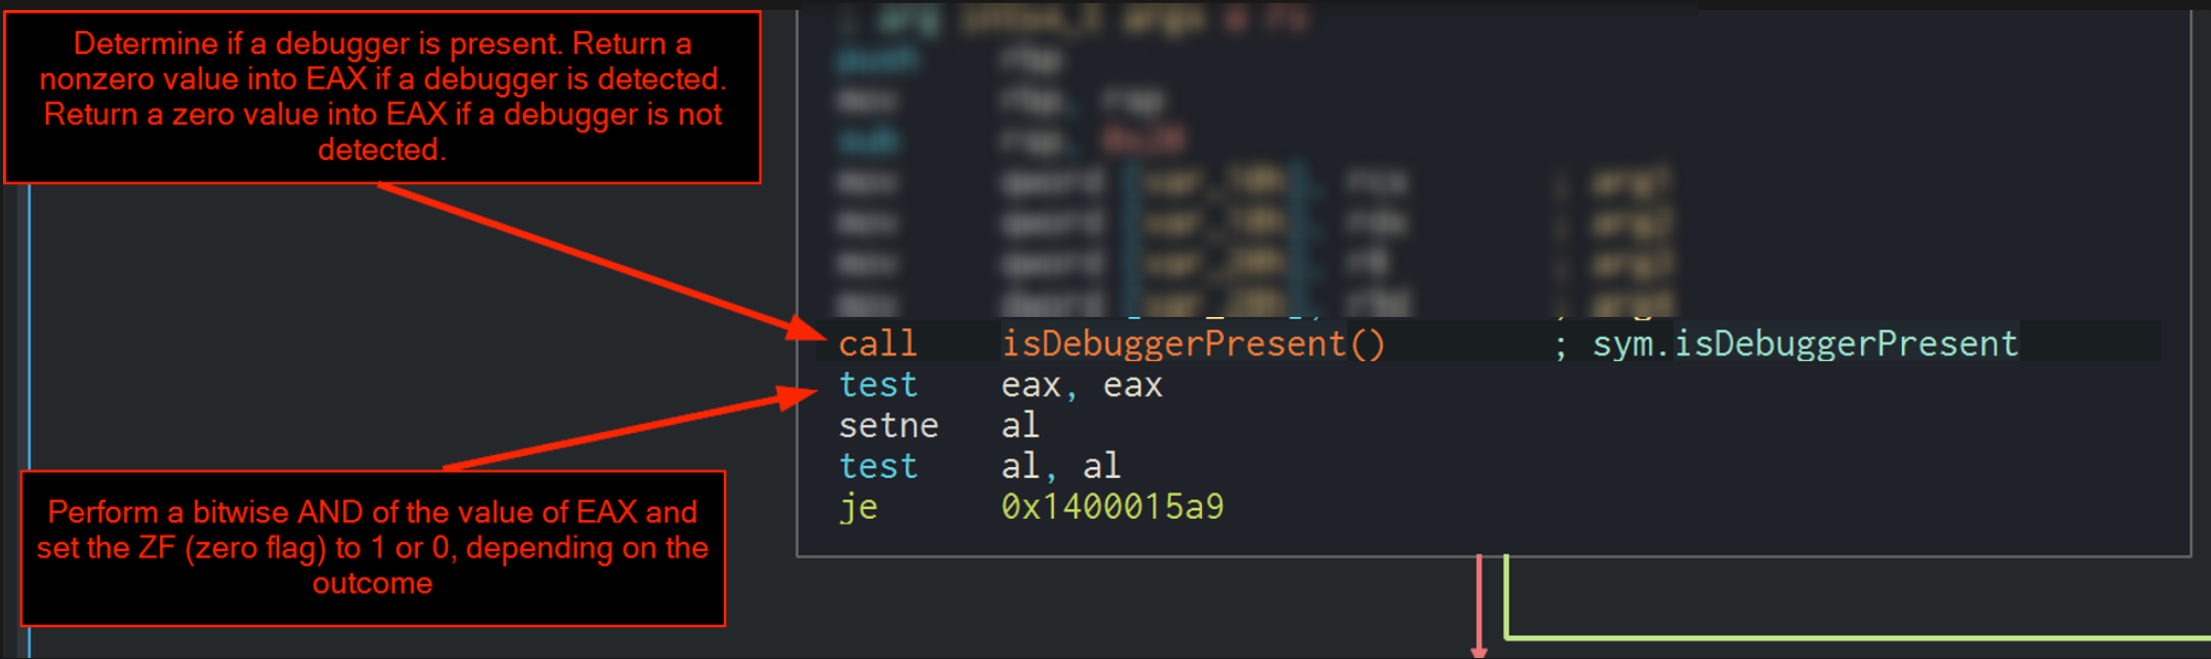
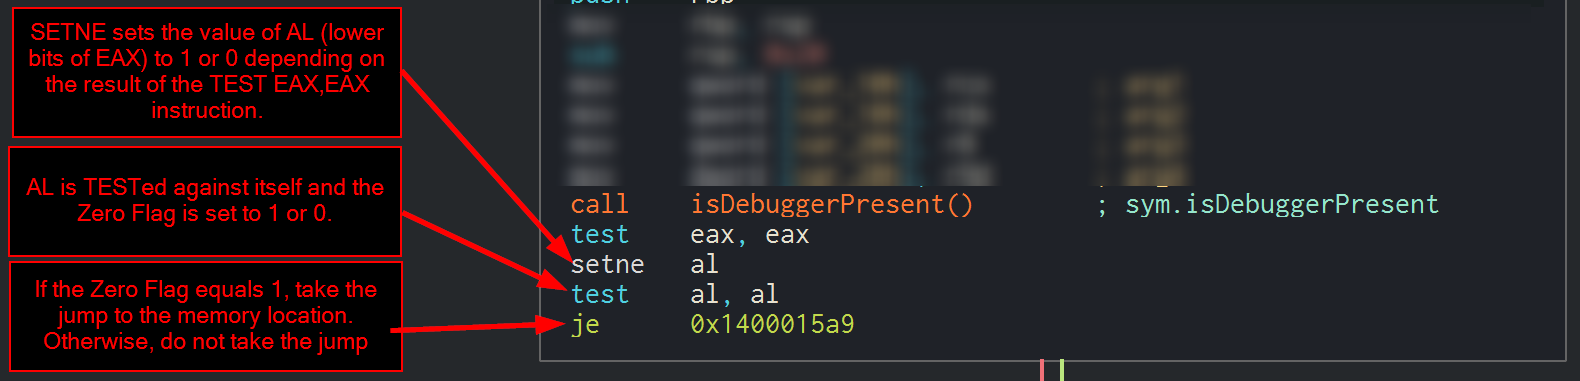
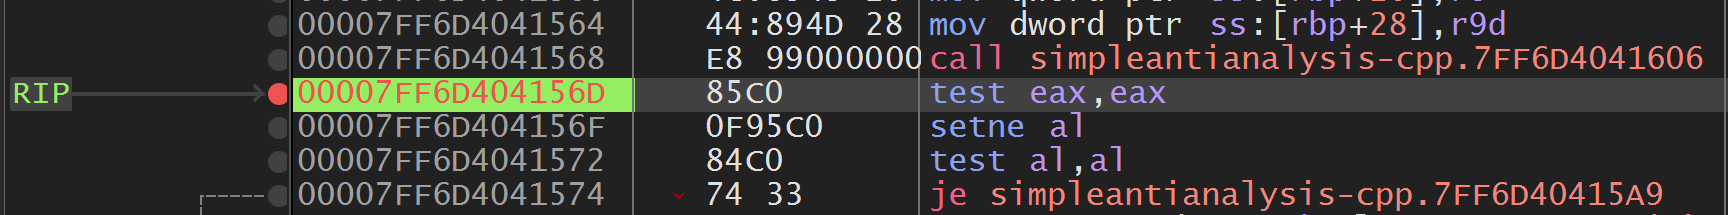
The core anti-debugging logic consists of only a few instructions.
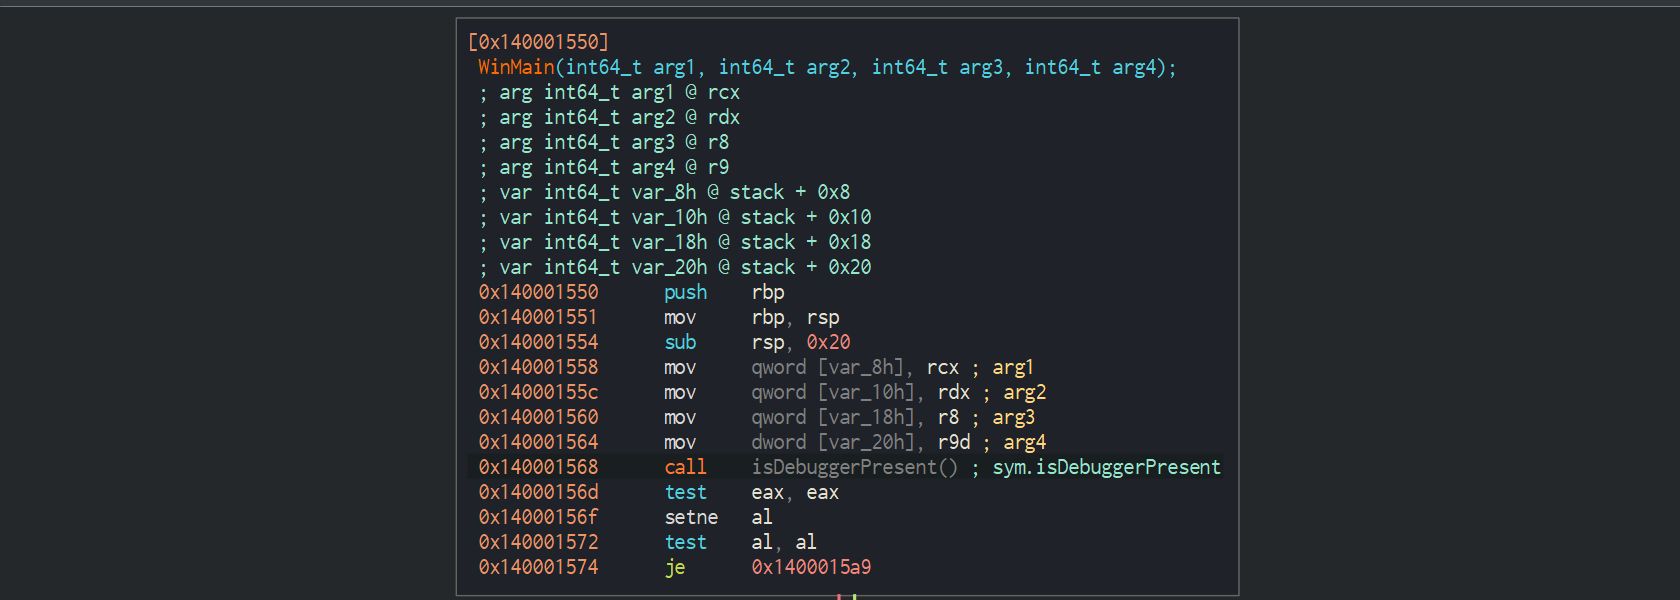
call    IsDebuggerPresent
test    eax,eax
setne   al
test    al,al
je      0x1400015a9
Although short, these instructions completely control the malware’s execution flow.
Step 1 – Calling the API
Execution begins with:
call IsDebuggerPresent
The Windows API performs the debugger check internally before returning to the caller.
Its return value is stored inside EAX.
If a debugger exists:
1
EAX = 1
Otherwise:
1
EAX = 0
This return value is the foundation for the remaining instructions.
Step 2 – Testing the Return Value
Immediately after the API call:
test eax,eax
This instruction performs a bitwise AND of EAX against itself.
1
EAX AND EAX
The register itself is not modified.
Instead, the processor updates its status flags.
The important flag here is:
- Zero Flag (ZF)
If EAX equals zero:
1
ZF = 1
Otherwise:
1
ZF = 0
Although this is a 64-bit application, EAX is still used because the returned BOOL value easily fits within 32 bits.
Step 3 – The SETNE Instruction
The next instruction is:
setne al
SETNE means:
Set if Not Equal
More precisely:
Set the destination operand to 1 if the Zero Flag equals 0.
Otherwise:
Set it to 0.
This instruction copies the logical result of the previous TEST into the AL register.
| Zero Flag | AL |
|---|---|
| 0 | 1 |
| 1 | 0 |
No jumps occur yet.
The processor is simply preparing for the upcoming comparison.
Step 4 – Testing AL
Next comes:
test al,al
Again, this performs a bitwise AND.
1
AL AND AL
Just like before, this updates only the processor flags.
If AL equals zero:
1
ZF = 1
Otherwise:
1
ZF = 0
The Zero Flag now accurately represents whether a debugger was detected.
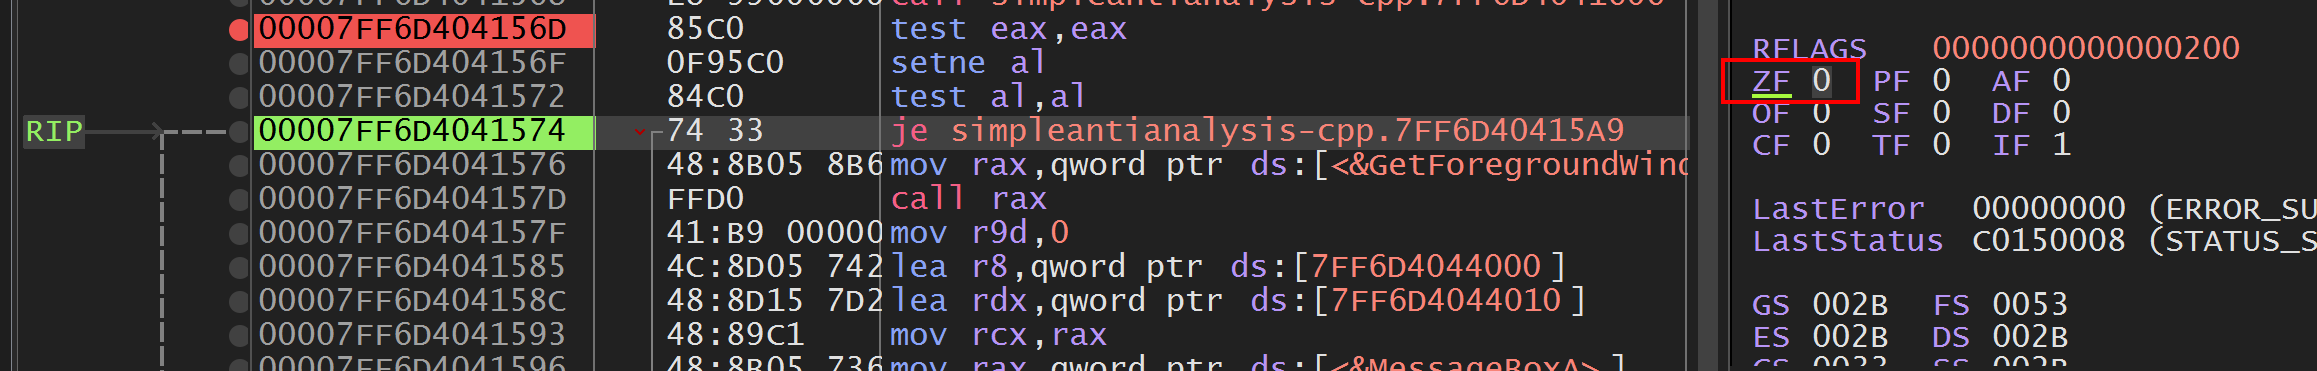
Step 5 – The Conditional Jump
Finally, execution reaches:
je 0x1400015a9
JE means:
Jump if Equal
More specifically:
Jump when the Zero Flag equals 1.
This single instruction determines whether the malware proceeds to execute its payload or follows the anti-debugging path.
Program Logic
When no debugger is attached:
1
2
3
4
5
6
7
8
9
10
11
12
13
14
15
16
17
18
19
20
21
22
23
24
25
26
27
28
29
30
31
32
33
34
35
36
37
IsDebuggerPresent()

↓

0

↓

TEST EAX,EAX

↓

ZF = 1

↓

SETNE AL

↓

AL = 0

↓

TEST AL,AL

↓

ZF = 1

↓

JE Taken

↓

Continue execution
When a debugger is attached:
1
2
3
4
5
6
7
8
9
10
11
12
13
14
15
16
17
18
19
20
21
22
23
24
25
26
27
28
29
30
31
32
33
34
35
36
37
IsDebuggerPresent()

↓

1

↓

TEST EAX,EAX

↓

ZF = 0

↓

SETNE AL

↓

AL = 1

↓

TEST AL,AL

↓

ZF = 0

↓

JE NOT Taken

↓

Debugger Detected
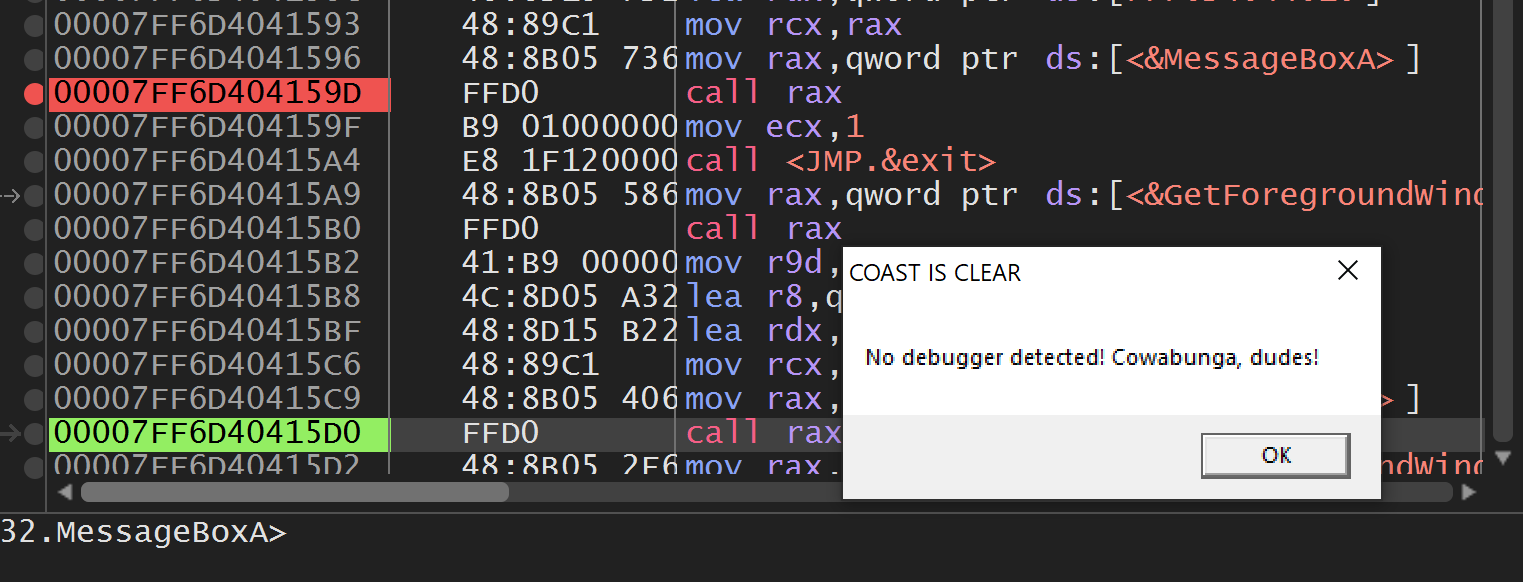
Executing Without a Debugger
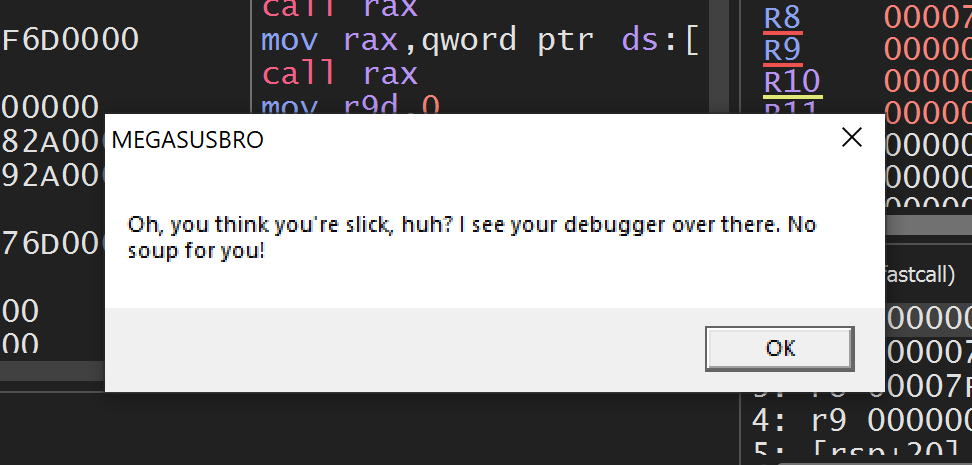
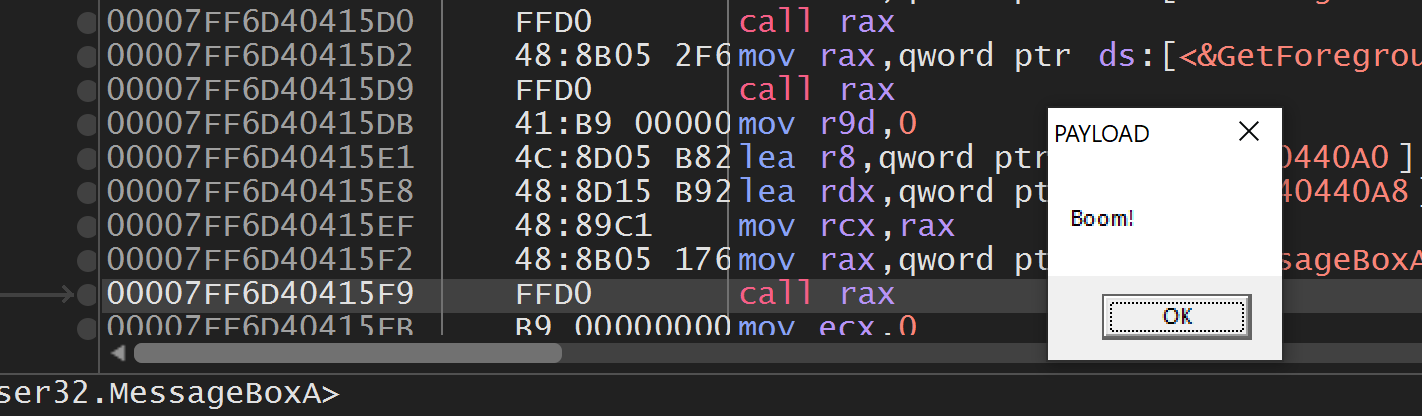
Running the executable normally results in the following message:
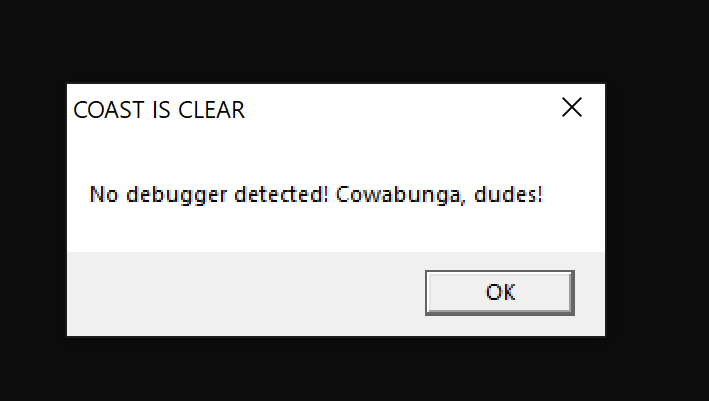
Immediately afterward, the payload executes.
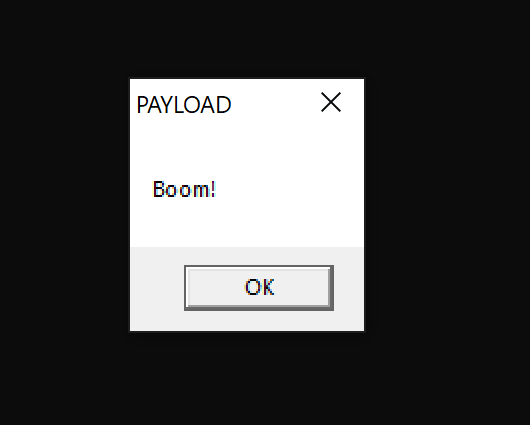
Since no debugger is attached, the malware follows its intended execution path.
Executing Inside x64dbg
Now launch the executable inside x64dbg.
When execution reaches the anti-debugging logic, the malware detects the debugger and immediately displays:
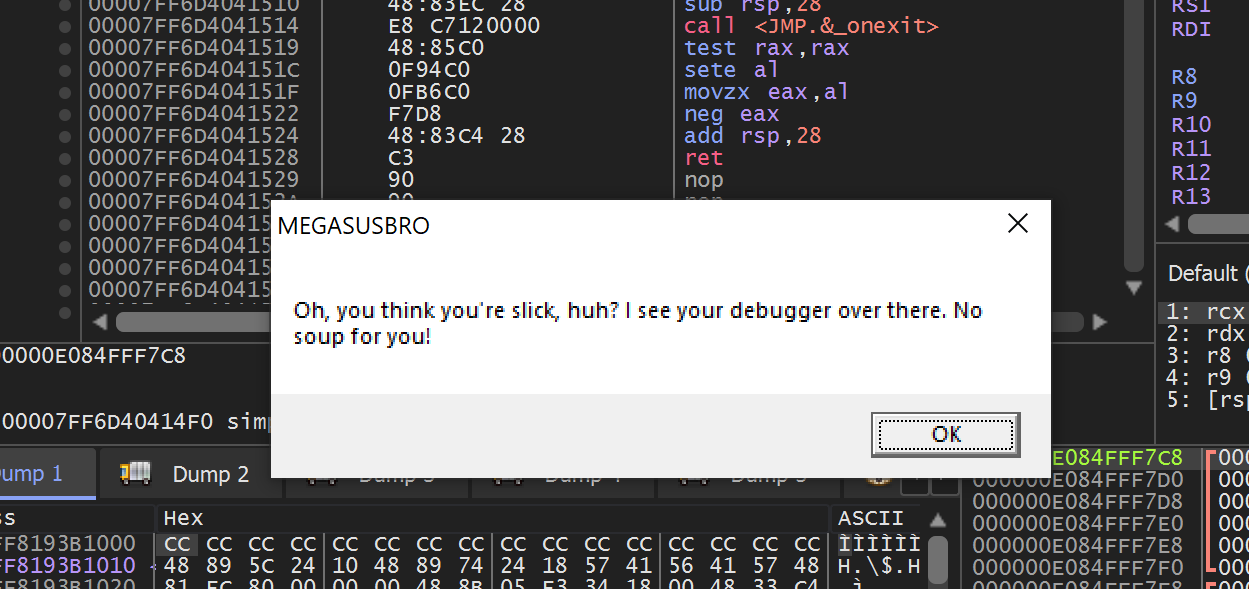
Instead of executing the payload, the malware terminates.
The anti-analysis technique has successfully prevented execution.
High-Level Equivalent
The assembly instructions are functionally identical to the following C-style pseudocode:
1
2
3
4
5
6
7
8
9
10
11
12
13
14
15
16
17
18
19
20
21
22
23
24
25
26
27
28
29
if (IsDebuggerPresent())
{
    MessageBox(
        GetForegroundWindow(),
        "Oh, you think you're slick, huh? I see your debugger over there. No soup for you!",
        "MEGASUSBRO",
        MB_OK
    );

    exit(EXIT_FAILURE);
}
else
{
    MessageBox(
        GetForegroundWindow(),
        "No debugger detected! Cowabunga, dudes!",
        "COAST IS CLEAR",
        MB_OK
    );

    MessageBox(
        GetForegroundWindow(),
        "Boom!",
        "PAYLOAD",
        MB_OK
    );

    exit(EXIT_SUCCESS);
}
Although the assembly appears complicated at first glance, it ultimately performs a simple conditional statement.
Dynamic Patching in x64dbg
Previously, we modified the executable on disk using Cutter.
This time we will perform the modification only in memory.
No bytes inside the executable are changed permanently.
Instead, we alter the running process.
This technique is known as dynamic patching.
Locating the Check
Restart the executable inside x64dbg.
Execute the program until the debugger detection message appears.
Restart the process (Ctrl + F2) so execution returns to the program entry point.
Inside the CPU window select:
1
2
3
4
5
6
7
8
9
Search For

↓

All Modules

↓

String References
Search for:
1
IsDebuggerPresent
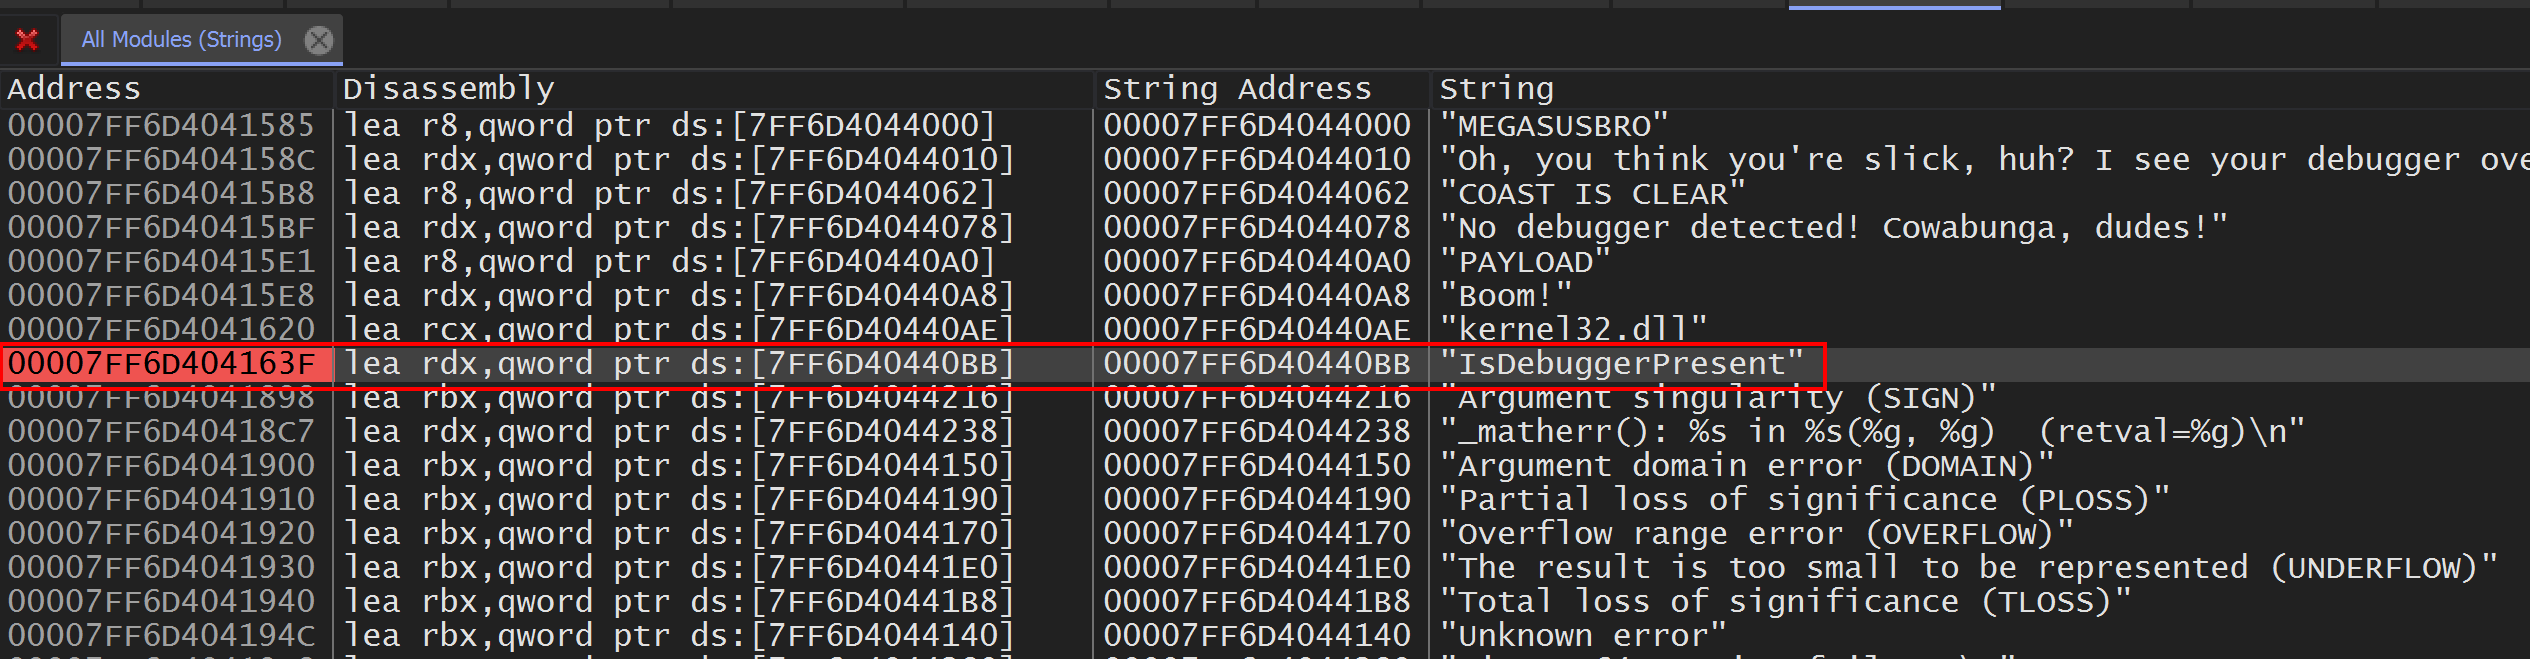
The string is used by GetProcAddress() to dynamically resolve the API.
This places us close to the debugger detection routine.
Set a breakpoint on this reference using F2.
Following Execution
Resume execution with F9.
Eventually the breakpoint triggers.
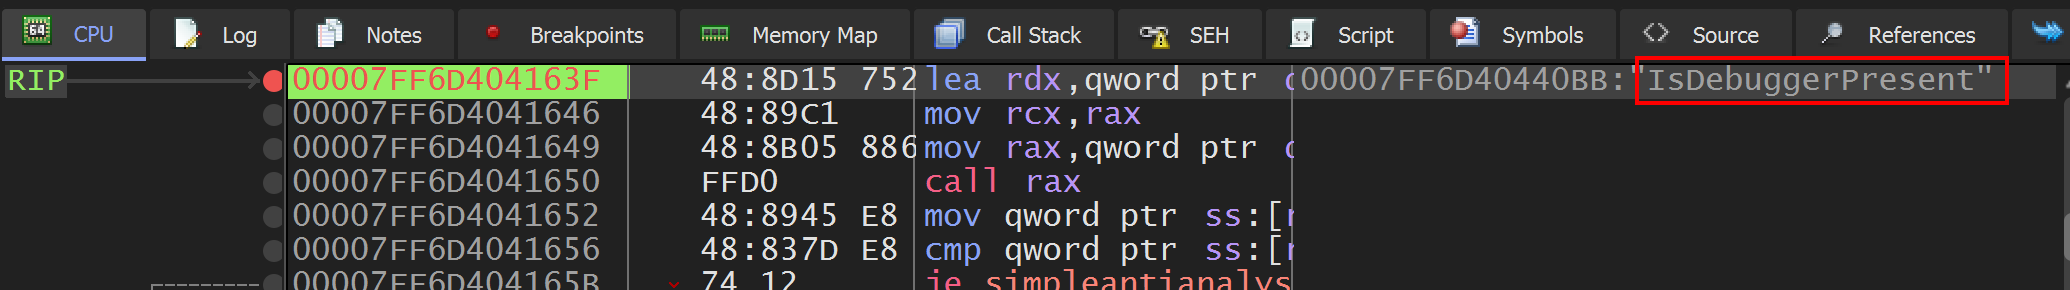
Continue stepping with F8 until the function returns.
Execution eventually reaches the familiar instruction sequence.
Notice that it exactly matches the instructions previously analyzed in Cutter.
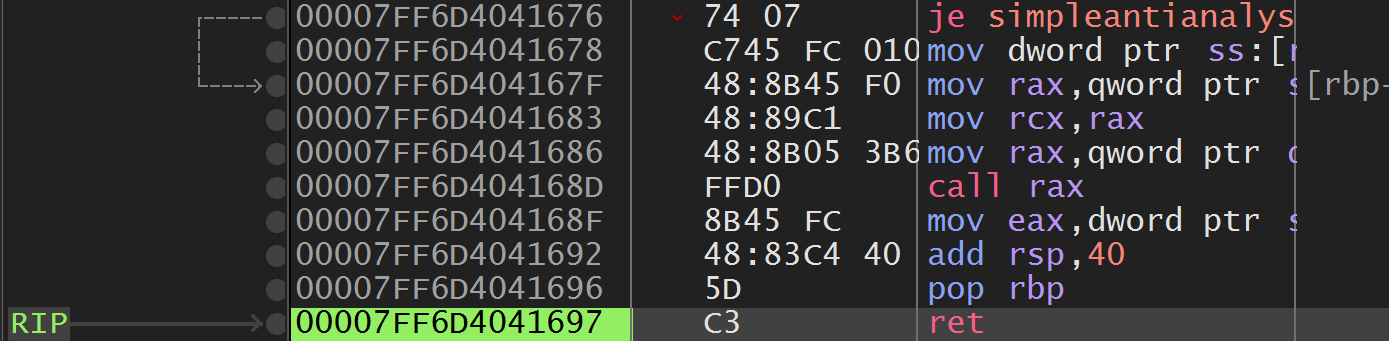
Inspecting the Zero Flag
When execution pauses on the JE instruction, observe the processor flags.
With a debugger attached:
1
ZF = 0
Since JE only jumps when ZF = 1, the malware proceeds into the debugger-detected branch.
Modifying Runtime State
Instead of changing the executable itself, we can modify the processor state.
Inside x64dbg simply double-click the Zero Flag.
1
2
3
4
5
6
7
ZF

0

↓

1

This changes only the current process memory.
Nothing is written back to disk.
From the malware’s perspective, the debugger check now appears to have succeeded.
Continuing Execution
Continue stepping through the program.
The malware now follows the alternate execution path.
The first message box appears.
Immediately afterward, the payload executes successfully.
Despite running inside a debugger, the anti-analysis protection has been completely bypassed.
Key Takeaways
- IsDebuggerPresent() is one of the most common Windows anti-debugging APIs.
- The API returns 0 when no debugger is attached and a non-zero value when one is detected.
- The malware converts this return value into processor flags using TEST and SETNE instructions.
- The JE instruction determines which execution path the malware follows.
- Static patching modifies the executable on disk, whereas dynamic patching modifies only the running process in memory.
- By changing the Zero Flag during execution, we redirected program flow without altering a single byte of the executable.
Conclusion
This lab demonstrated how a simple Windows anti-debugging technique can prevent malware from revealing its malicious functionality during analysis. By understanding the assembly instructions that process the return value of IsDebuggerPresent(), I identified the exact decision point controlling execution. Rather than permanently modifying the executable, I dynamically altered the processor’s Zero Flag at runtime, causing the malware to follow its normal execution path even while being debugged. This technique highlights the importance of understanding CPU flags and conditional branching, as even a single modified flag can completely change a program’s behavior during reverse engineering.